

The Map is Not the Territory: Why GAAP is a Simulation
Everything you read in an 8-K or 10-K is an opinion. Here is how to decompile the financial operating system and audit the reality behind the ledger.

// SYSTEM: CAPITAL [02]
// DATE: FEBRUARY 07, 2026
// EST: 10 MIN READ

Part I: The Regulator’s Confession
I have a confession to make. In my day job as a financial consultant in the area of bank regulation, I don’t trust numbers.
When a bank hands me a report stating their risk exposure (or EAD: exposure at default) is “X” I don’t see a fact. I see a construct. I see a result derived from a specific model, fed by specific assumptions, filtered through a specific regulatory framework. If I change the model, the number changes. The reality of the bank hasn’t changed - only the lens through which we view it.
But this principle applies to any industry and public company that is reporting financials. As investors, we often forget this. We look at a stock screener and see “P/E: 15x” or “net income: $500M.” We treat these numbers like physical constants - like the speed of light or the atomic weight of silicon.
But they aren’t physics. They are GAAP (Generally Accepted Accounting Principles). And GAAP is not truth. GAAP is a simulation.
And think about it. How should you seriously know everything that is going on in a company with hundreds of offices, multi-billion dollar revenues, thousands of clients, hundreds of suppliers, tens of thousands of employees and million of business transactions each quarter. Answer: you can’t. You need a system.
A model that is generally accepted (normed) so that you can assess performance and make it comparable across segments, geographies, and even corporations.
They are the “generally accecpted” accounting “principles”. Accounting is an abstraction layer for the business similar to what a programming language is to software. The programming language is either IFRS, US-GAAP or any national accounting standard (think of it like C#, Java, Python - each with their own quirks, syntax and idioms).
Part II: The Architecture (The Three Infinite Loops)
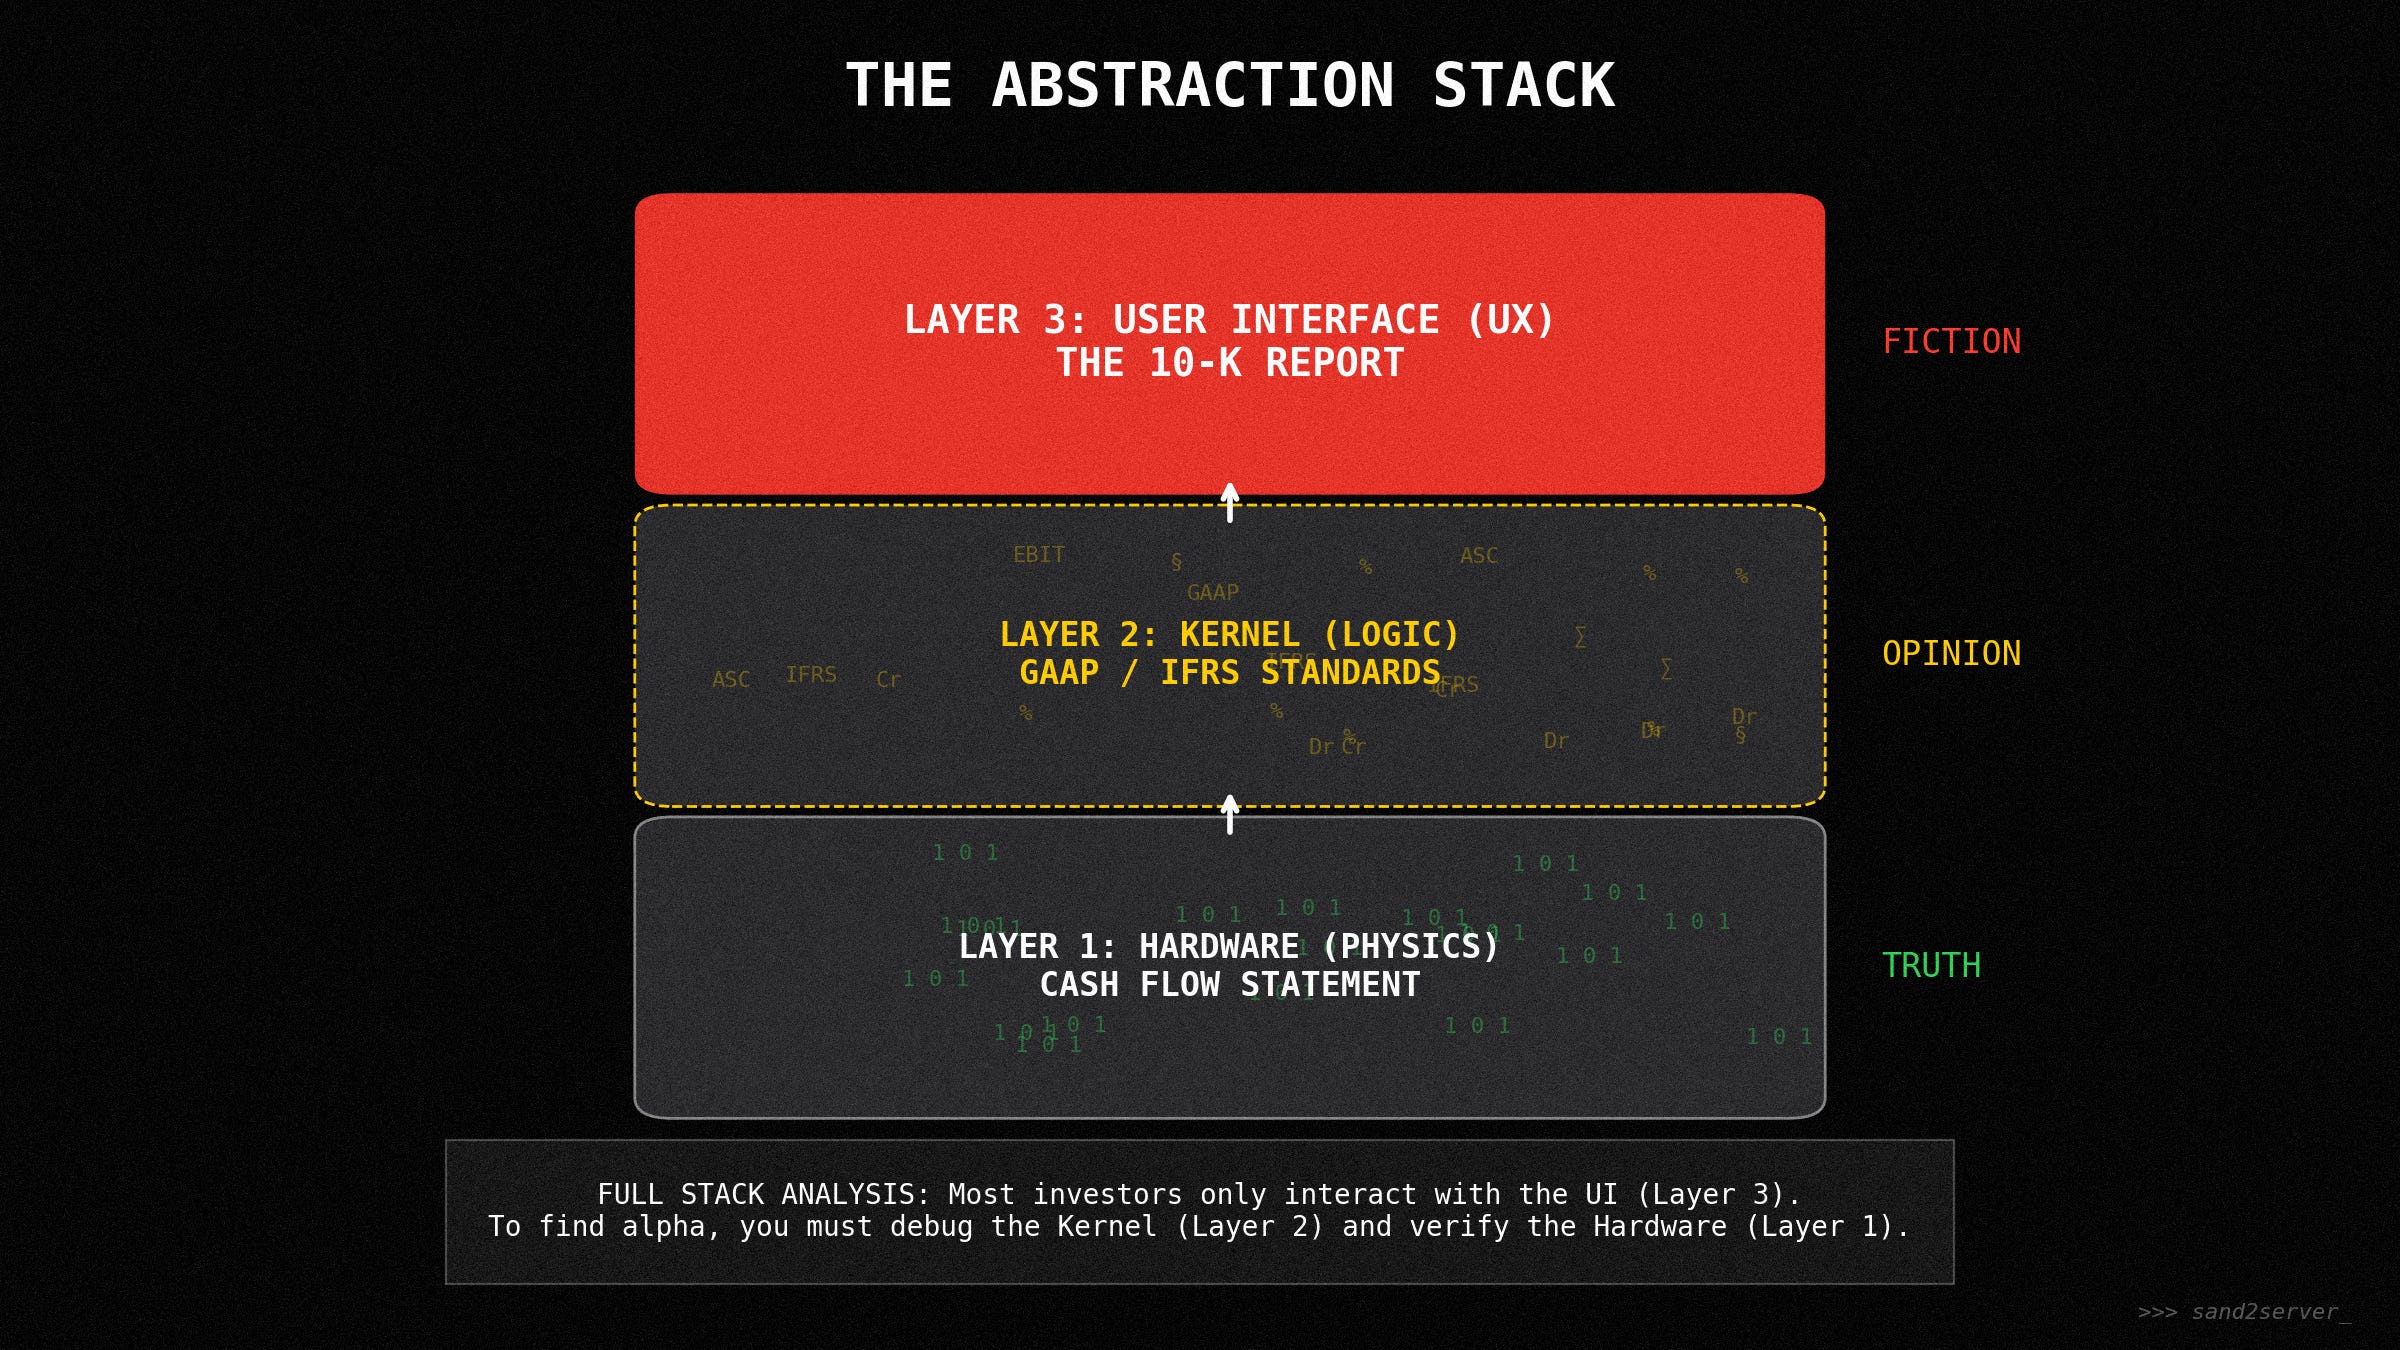
Before we debug specific modules, we must understand the system architecture. The three financial statements are not separate documents; they are a single, continuous loop of logic. If you touch one, the others move. They must “balance” - which is accounting speak for “the code compiles”.
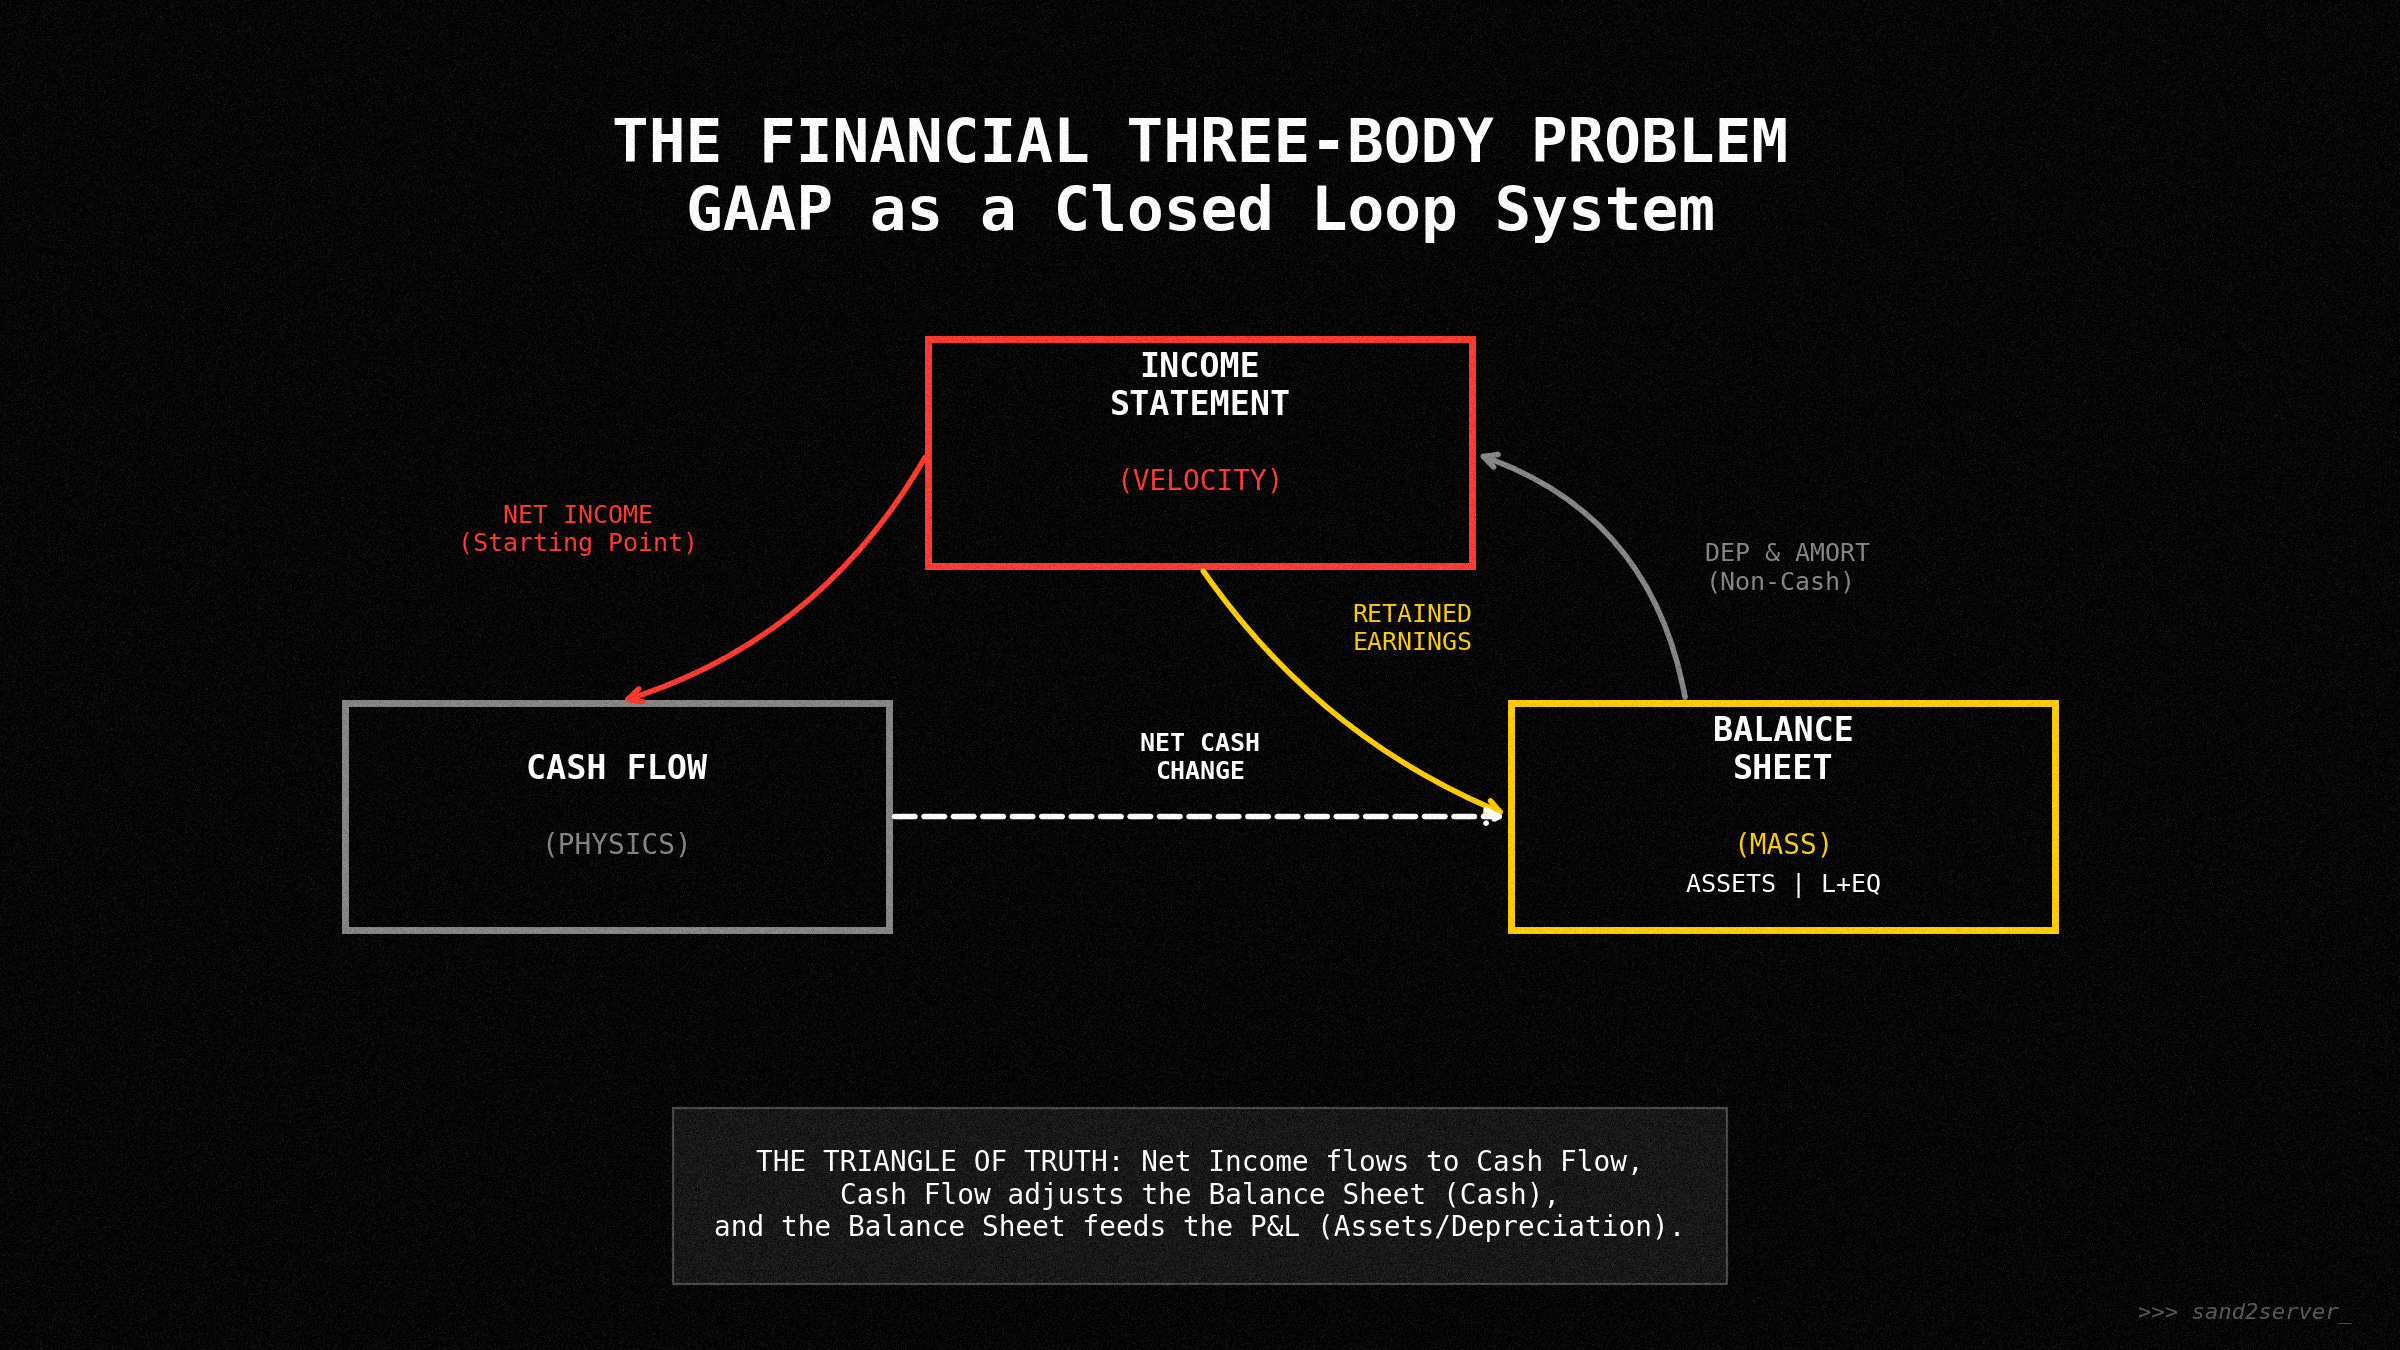
The Income Statement (The Flow): Measures velocity. This is the “user interface.” It is where management tells their story.
The Balance Sheet (The State): Measures the “hardware.” It’s a snapshot of the system’s health at a single millisecond.
The Cash Flow Statement (The Physics): This is the ground truth. While profit is an opinion, cash is a fact. Cash is the only variable that cannot be faked indefinitely.
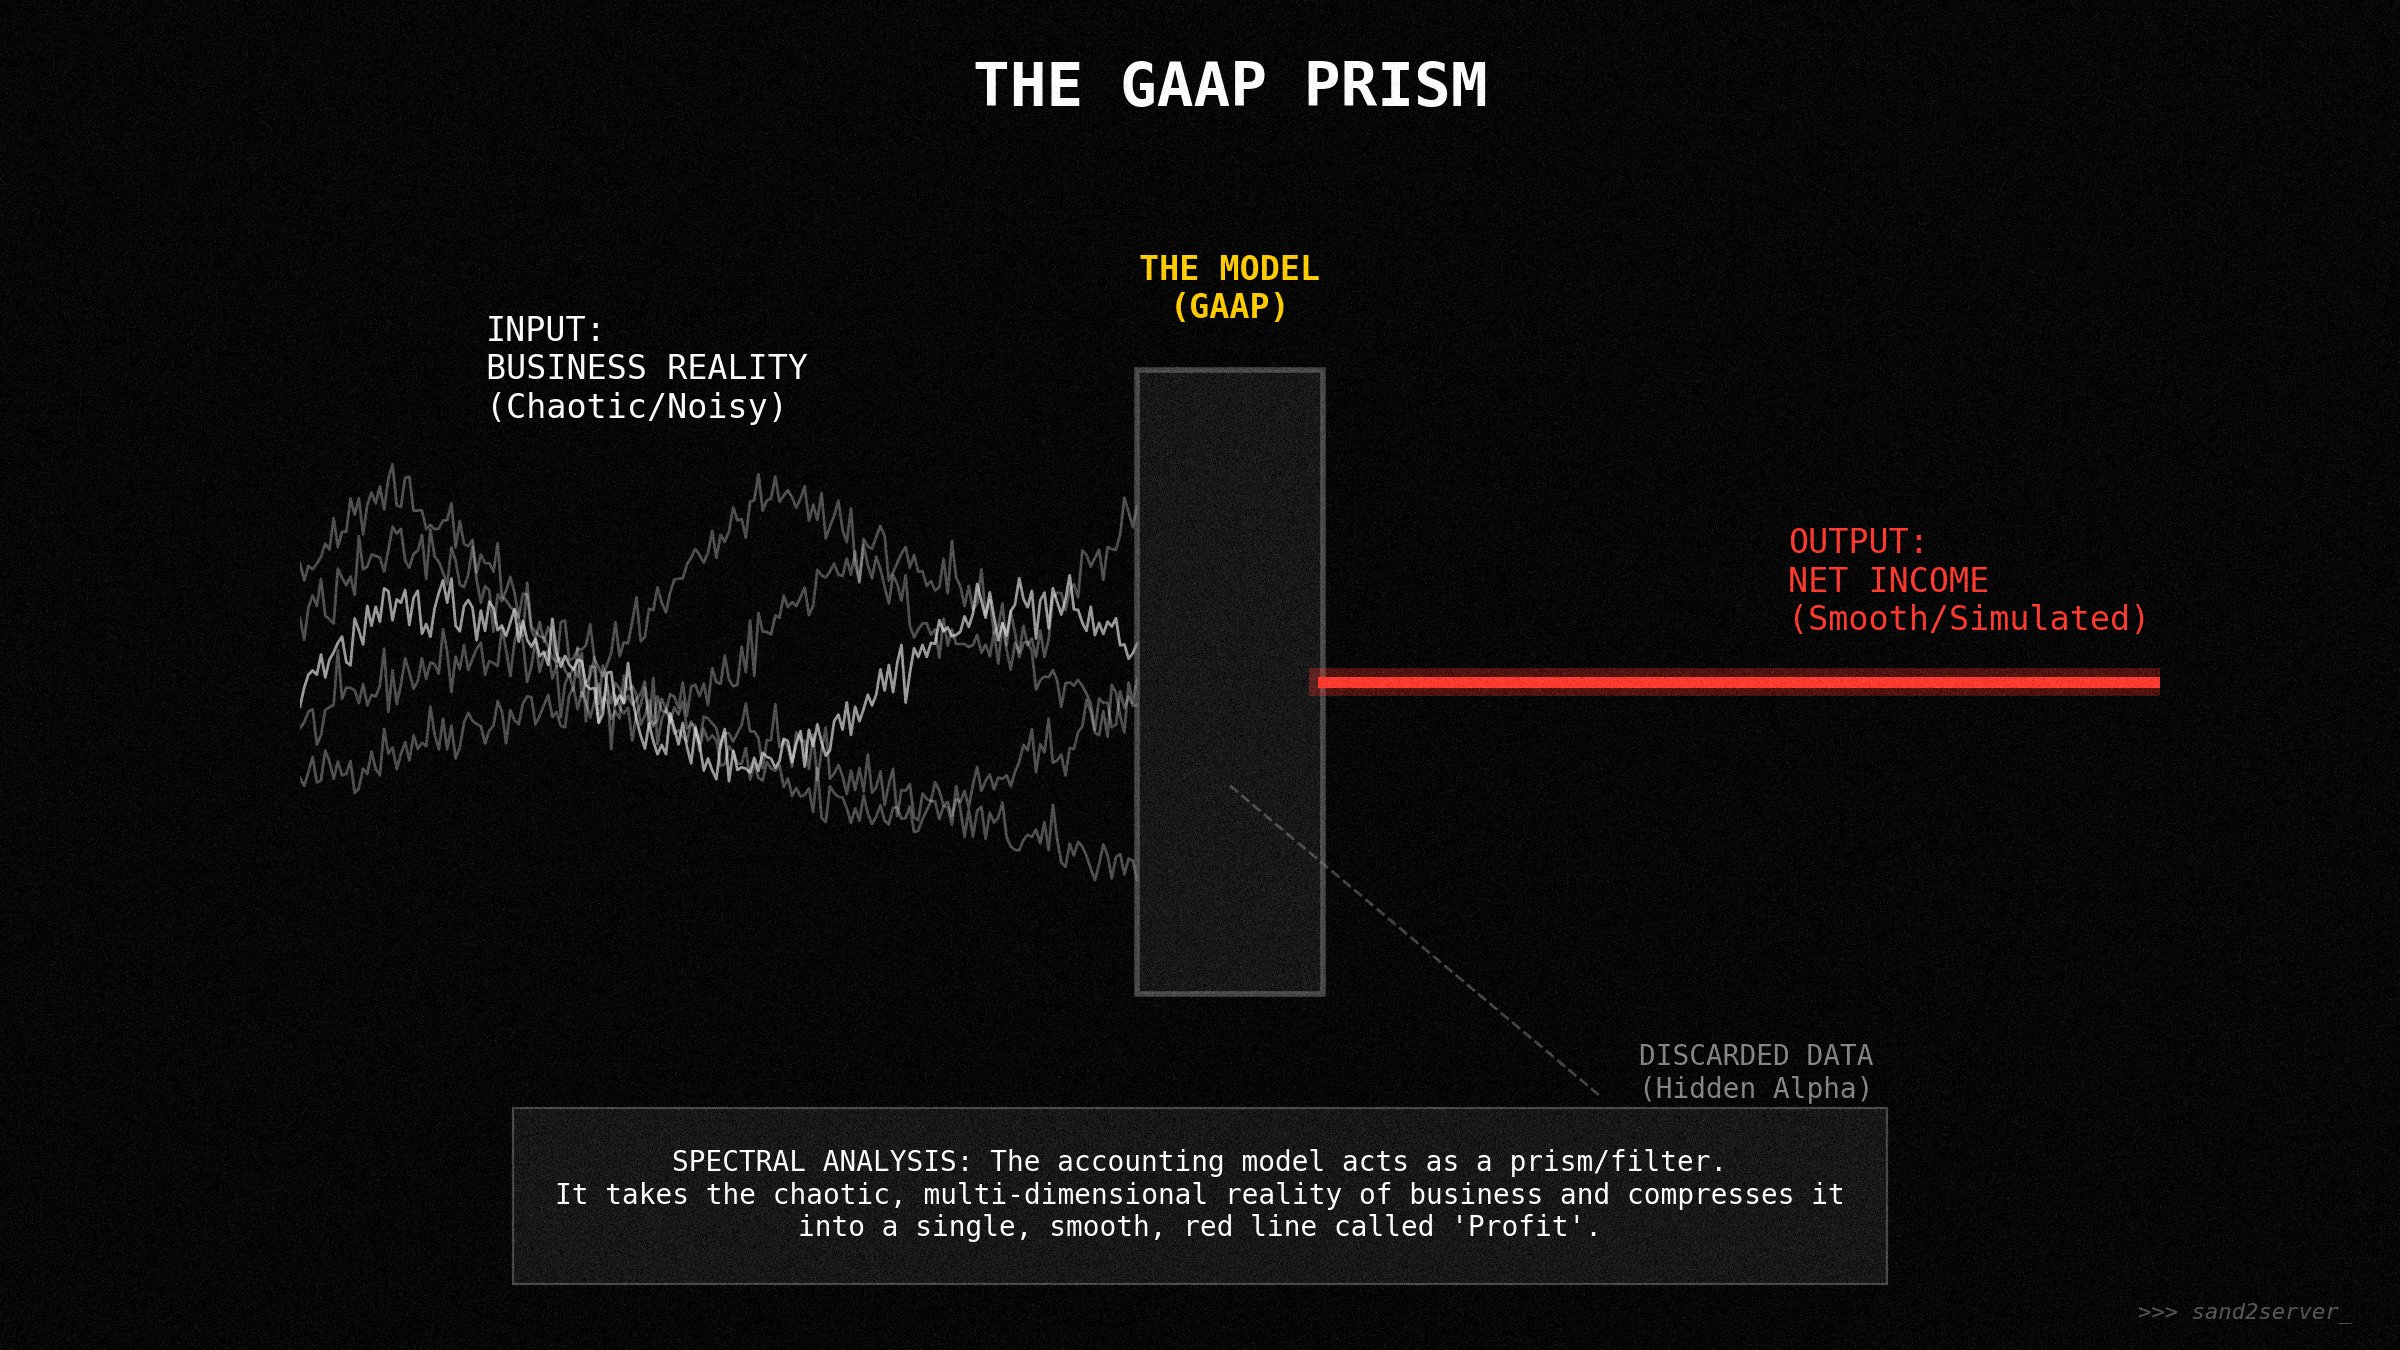
Part III: The JPEG Problem (Lossy Compression)
Accounting is a compression algorithm. Like a JPEG image, it sacrifices nuance for standardization. The “Alpha” exists in the data discarded during compression. To find it, you must decompile the “source code” found in the 10-K footnotes.
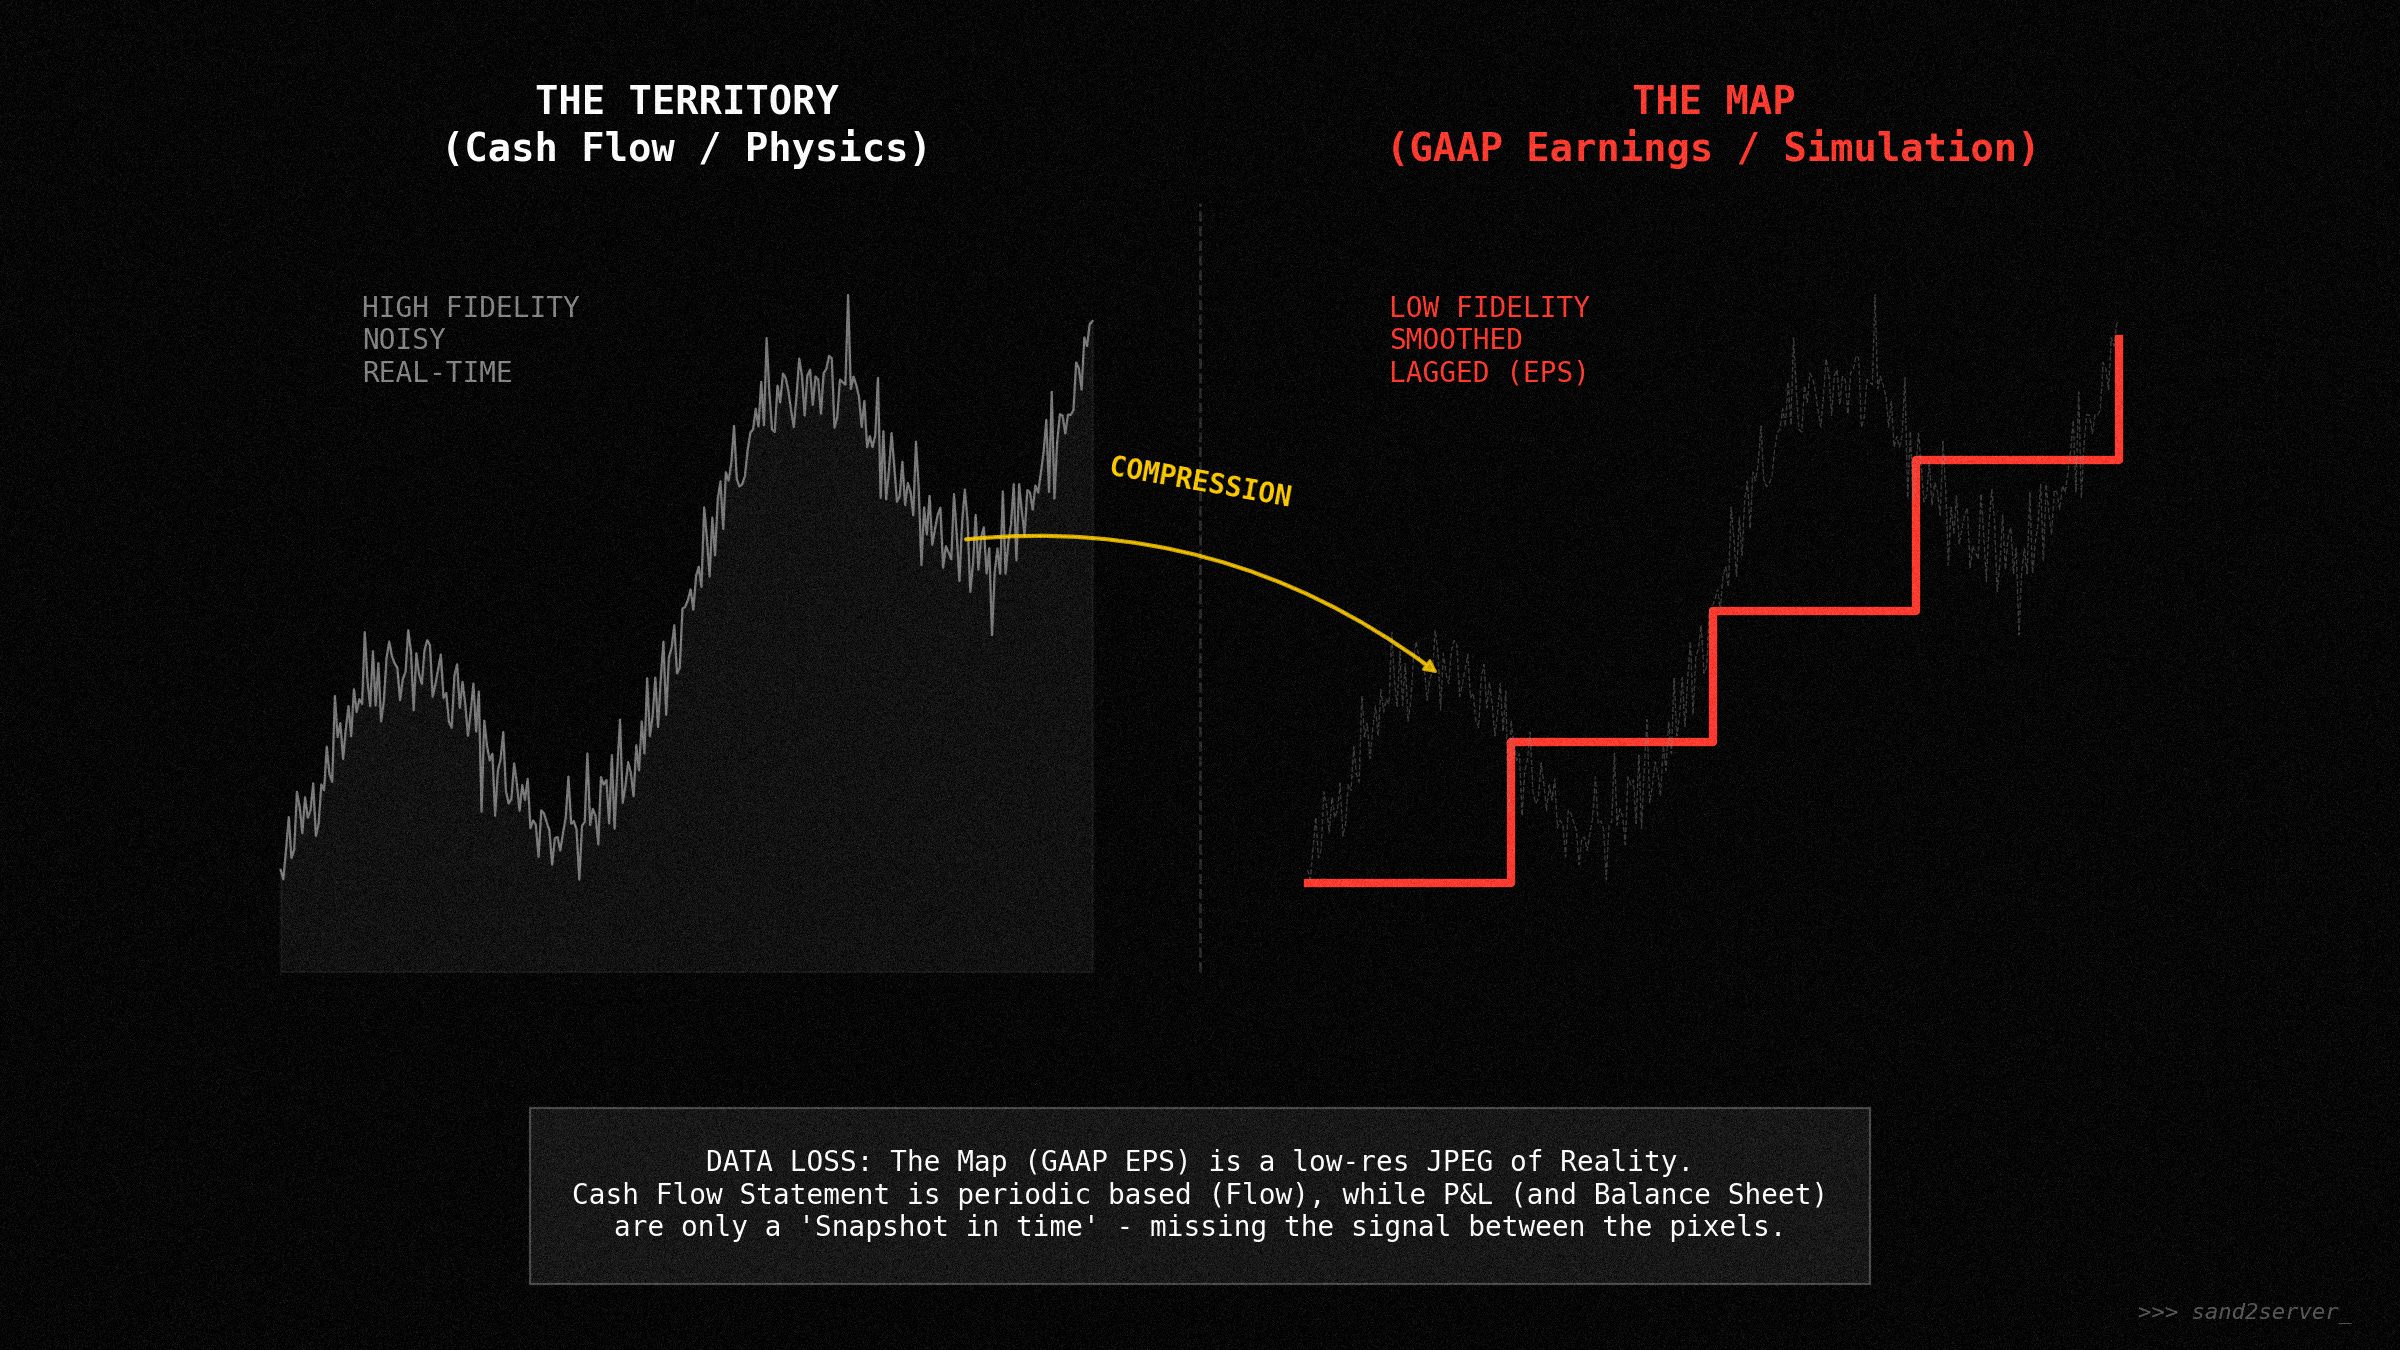
Basically what GAAP or other accounting standards end up doing is sampling the high frequency reality of the business world in very low frequency intervals, usually quarterly, sometimes semi-annually. Herein lies some profound misconception in markets. The earnings reported every quarter are not only following the business cylce quarter to quarter and fluctuate naturally, but companies generally have some “wiggle room” to either time or categorize certain bookings to make that “sampled” number look better at this particular point in time.
Sampling reality is just trying to provide you, the investor, one set of verifiable data points per quarter. But inherent to that system is the phyiscal constraint of the model. You get one data point, while the company is producing thousands of business transactions every single day (and contracts are signed, negotiated, the company is being sued, cash is changing hands and projects are being worked on).
The Debugger’s Rule:
Cash is Physics. Profit is a Narrative. Don’t trade the UI; audit the Source Code.

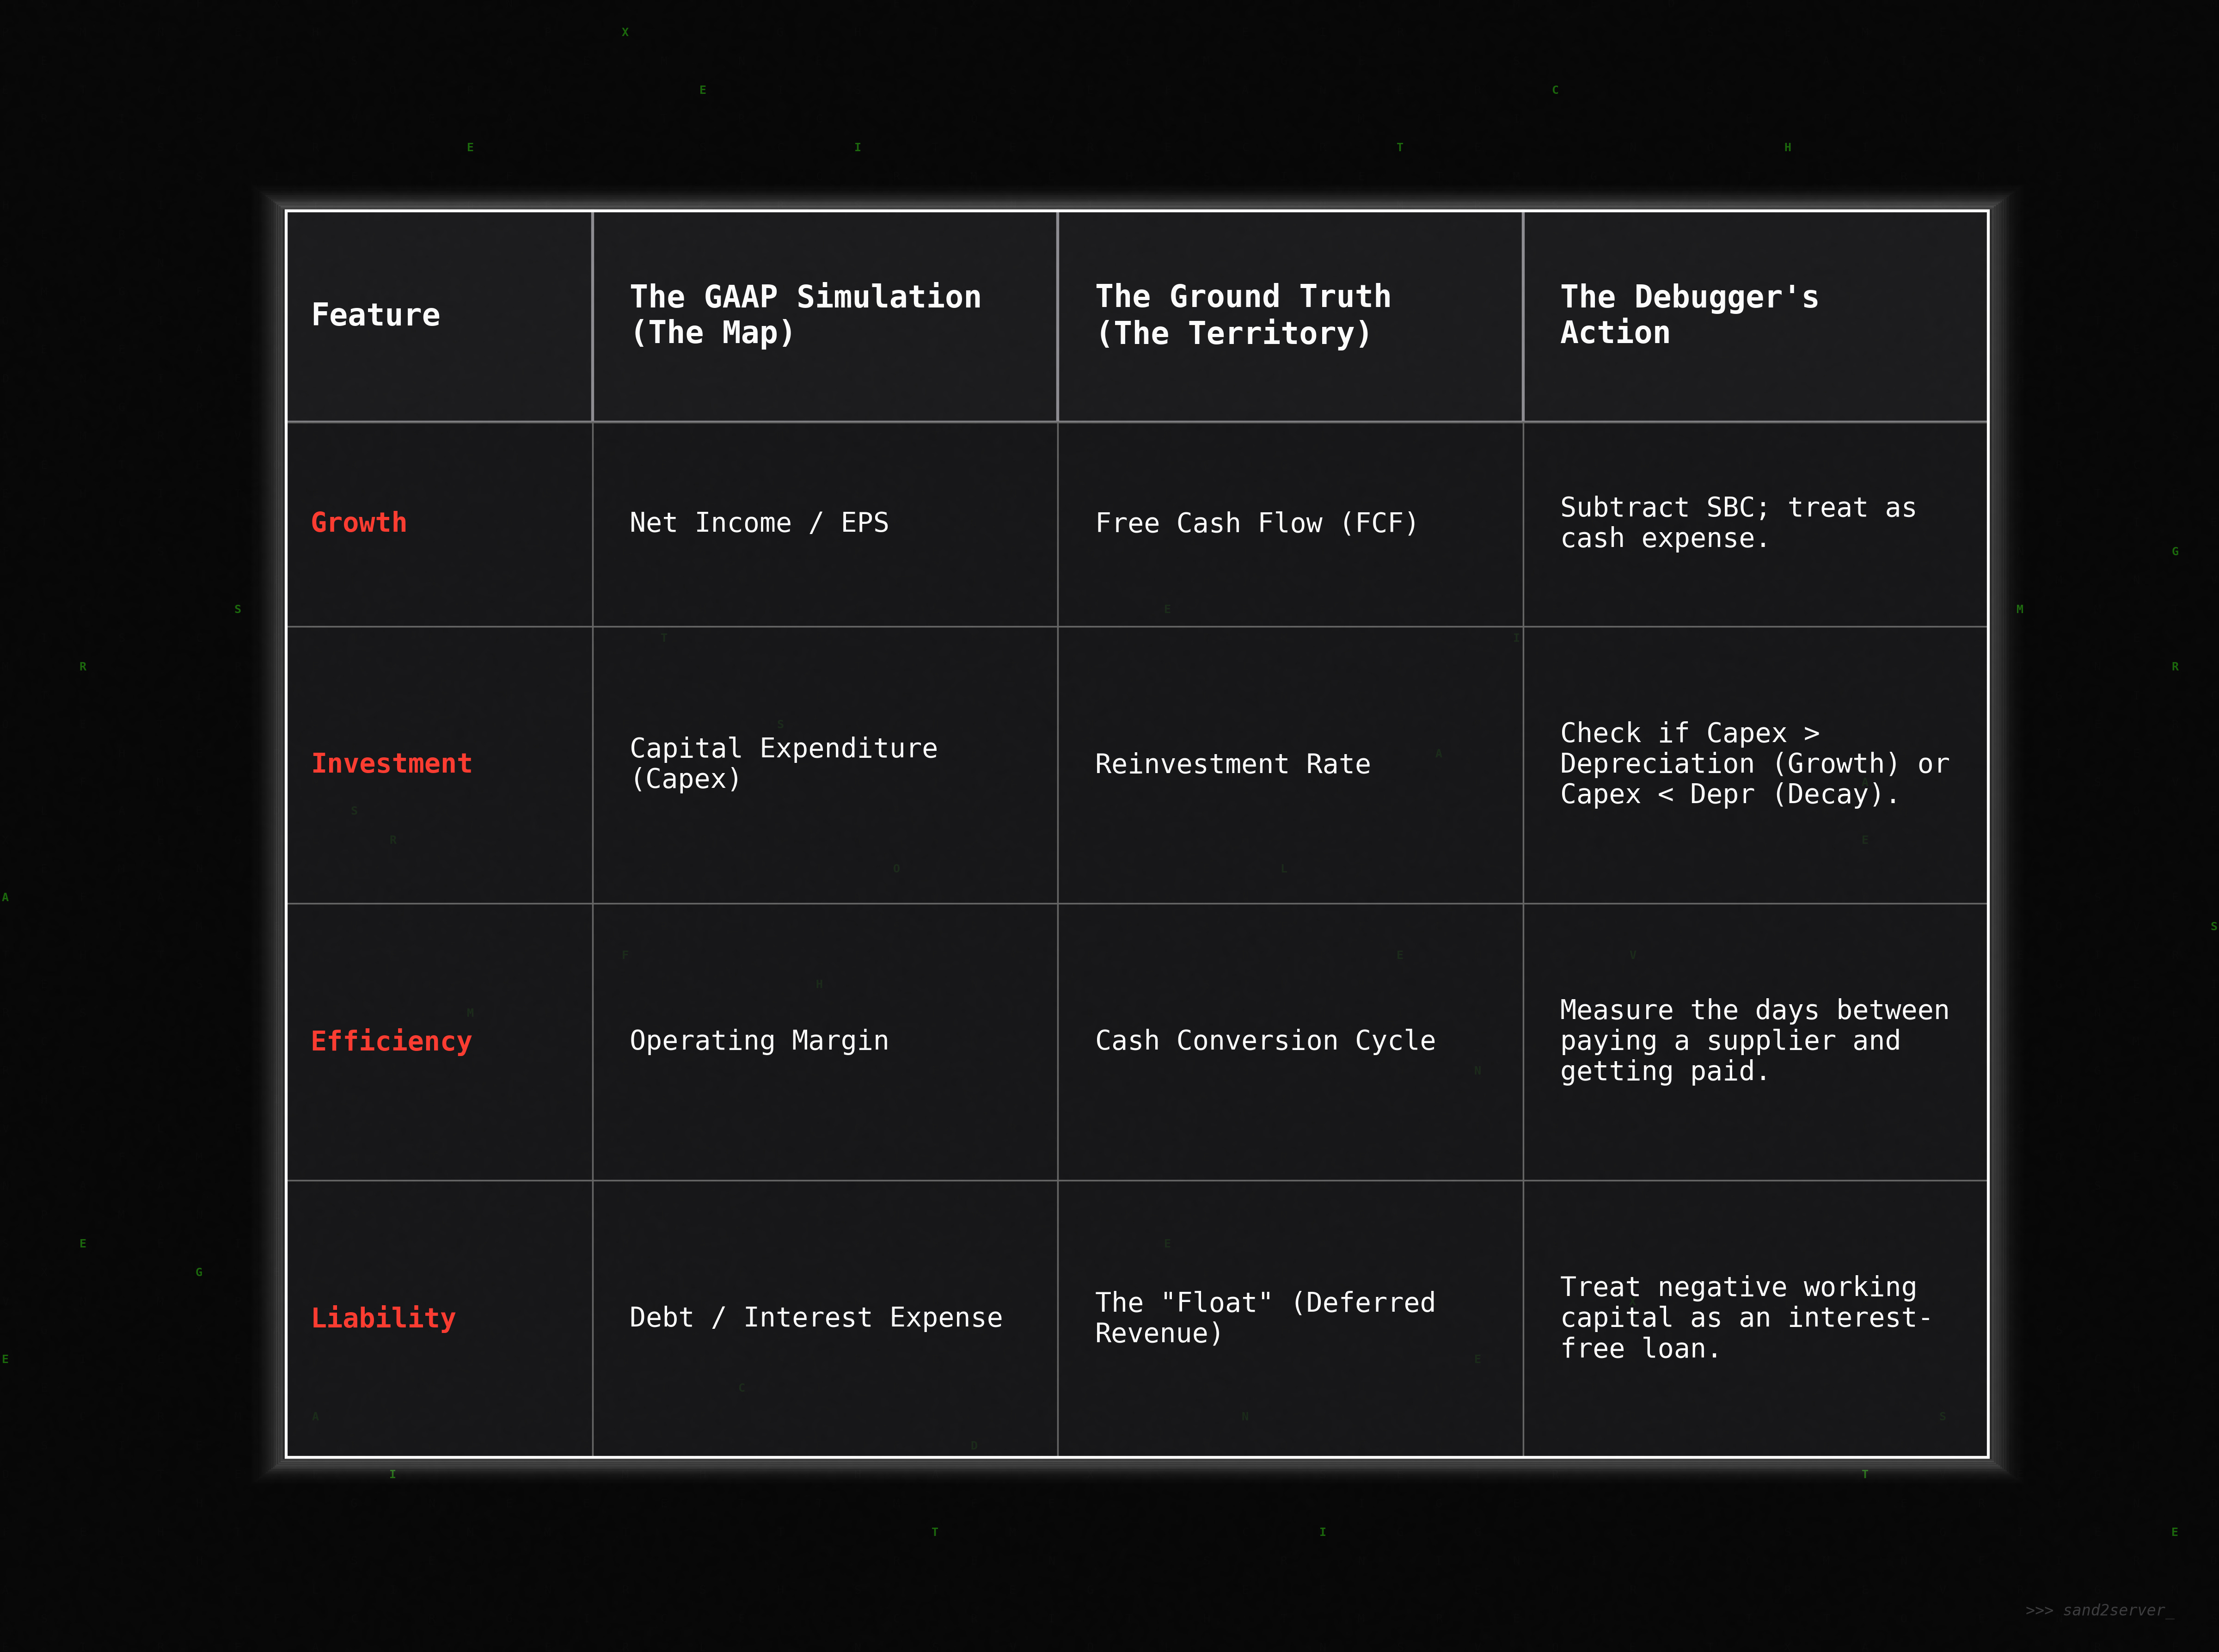
Part IV: The Debugger’s Scorecard (Simulation vs. Reality)
To move from a spectator to a full stack analyst, you must learn to translate GAAP metrics into “ground truth”.
The Debugger’s Scorecard
This is basically trying to decipher the simulation (GAAP) vs. reality (cash flow). The following matrix acts as the primary translation layer between accounting fiction (the map) and economic reality (the territory). By mapping distorted GAAP metrics like net income to their cash-based counterparts, we can expose the specific artifacts introduced by accrual accounting. The final column provides you with a functional set of "debugging instructions", basically a heuristic check that you can run against any public financial statement. This list is not exhaustive, but a teaser, which I’ll happily expand in future articles.
The Regulator’s Nightmare (The Model Break)
I want to leave you with a story from the regulatory trenches that keeps me up at night. I once sat in a risk committee where a bank’s entire solvency hung on a single variable: correlation. By changing the correlation assumption between two asset classes in an Excel cell, a multi-million dollar capital surplus turned into a multi-million dollar deficit. The bank hadn’t changed. The assets hadn’t changed. But the model broke. The market is not a solid object; it is a fragile simulation held together by assumptions. If you trust the P/E ratio blindly, you are trusting a model that can be broken by a single accountant’s keystroke.
The Patch: Running Your Own Unit Tests
To survive the simulation, you cannot just read the output; you must audit the code. Before I buy any stock, I run three ‘unit tests’ to see if the model holds up against physics:”
Test 1: The Quality Ratio (The Reality Check)
Code:
Operating Cash Flow / Net IncomeThe Bug: If this is
< 1.0for consecutive quarters, the company is booking profit that hasn’t actually hit the bank account.
Test 2: The Dilution Check (The SBC Burn)
Code:
Stock Based Comp / Free Cash FlowThe Bug: If this is
> 50%, the business isn’t funding itself; the employees are funding it. You aren’t buying a company; you’re buying a wealth transfer scheme.
Test 3: The Hardware Lag (Inventory Bloat)
Code:
Inventory Growth > Revenue GrowthThe Bug: This is a memory leak. The system is allocating cash to physical goods that the market is refusing to clear.
The table above is just version 1.0 of the debugger’s scorecard. It’s the basic patch. I’l happily update the list in a future piece.
Part V: Decompiling the Simulation (4 Common Glitches)
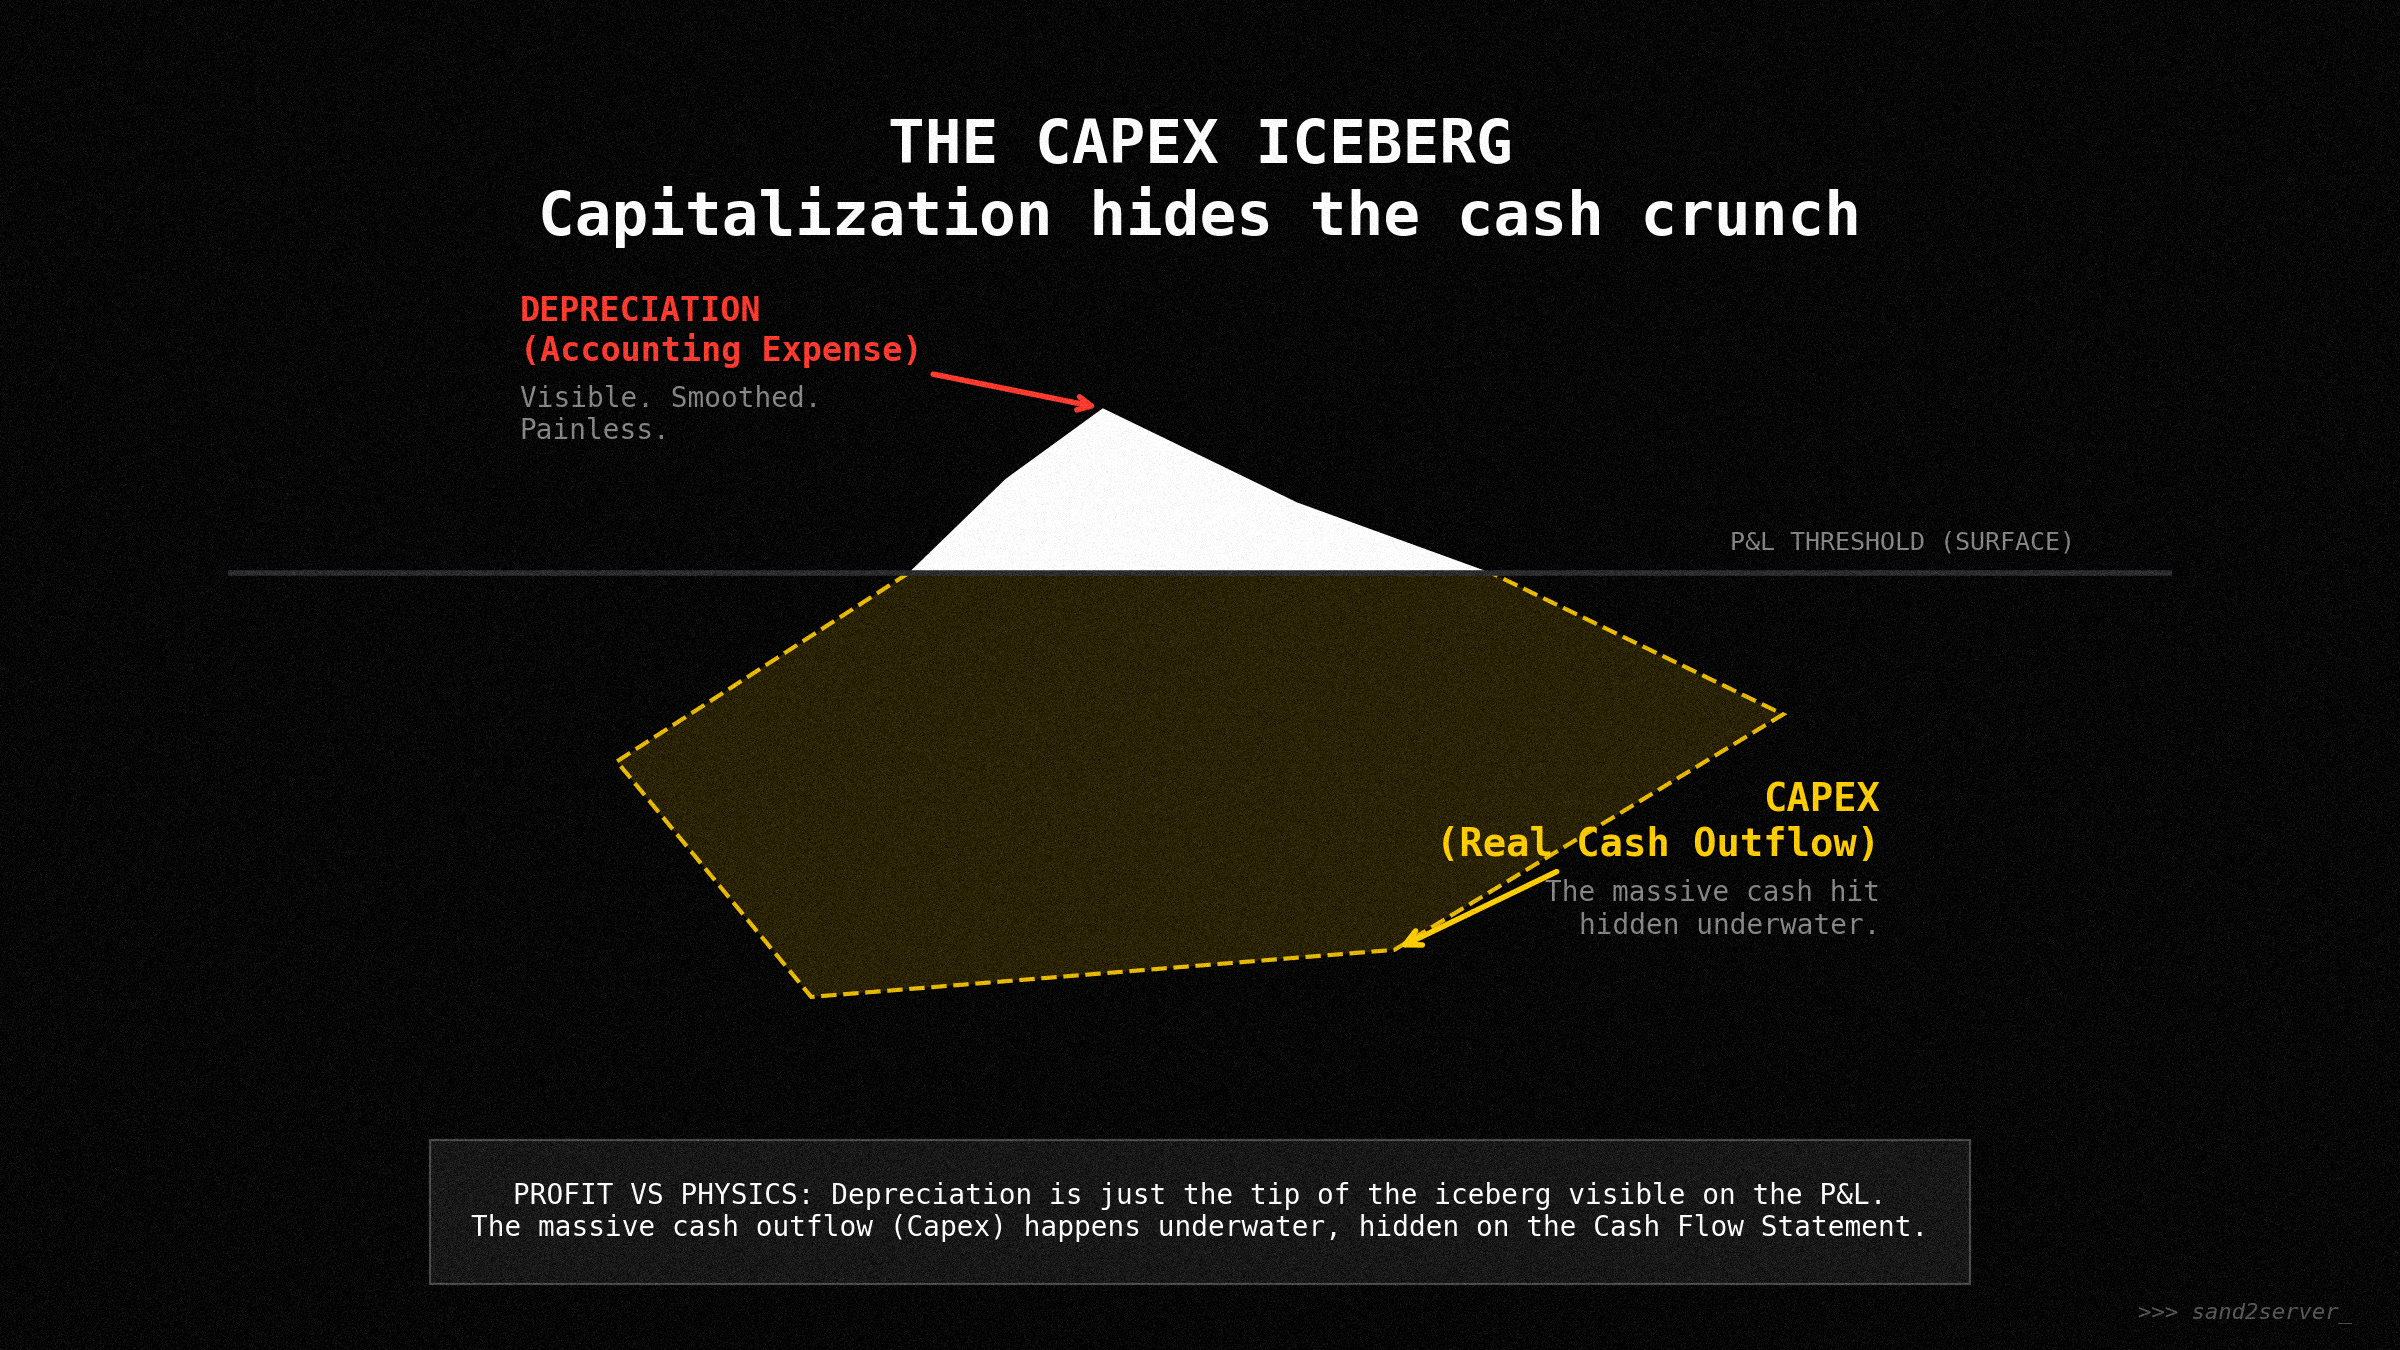
1. The Capex Shell Game (Capitalization vs. Expense)
In the GAAP simulation, if you buy a $1,000 server, you don’t lose $1,000 in profit today. You “capitalize” it, spreading the cost over years.
The Exploit: Management can hide current operational costs by labeling them as “growth investments.”
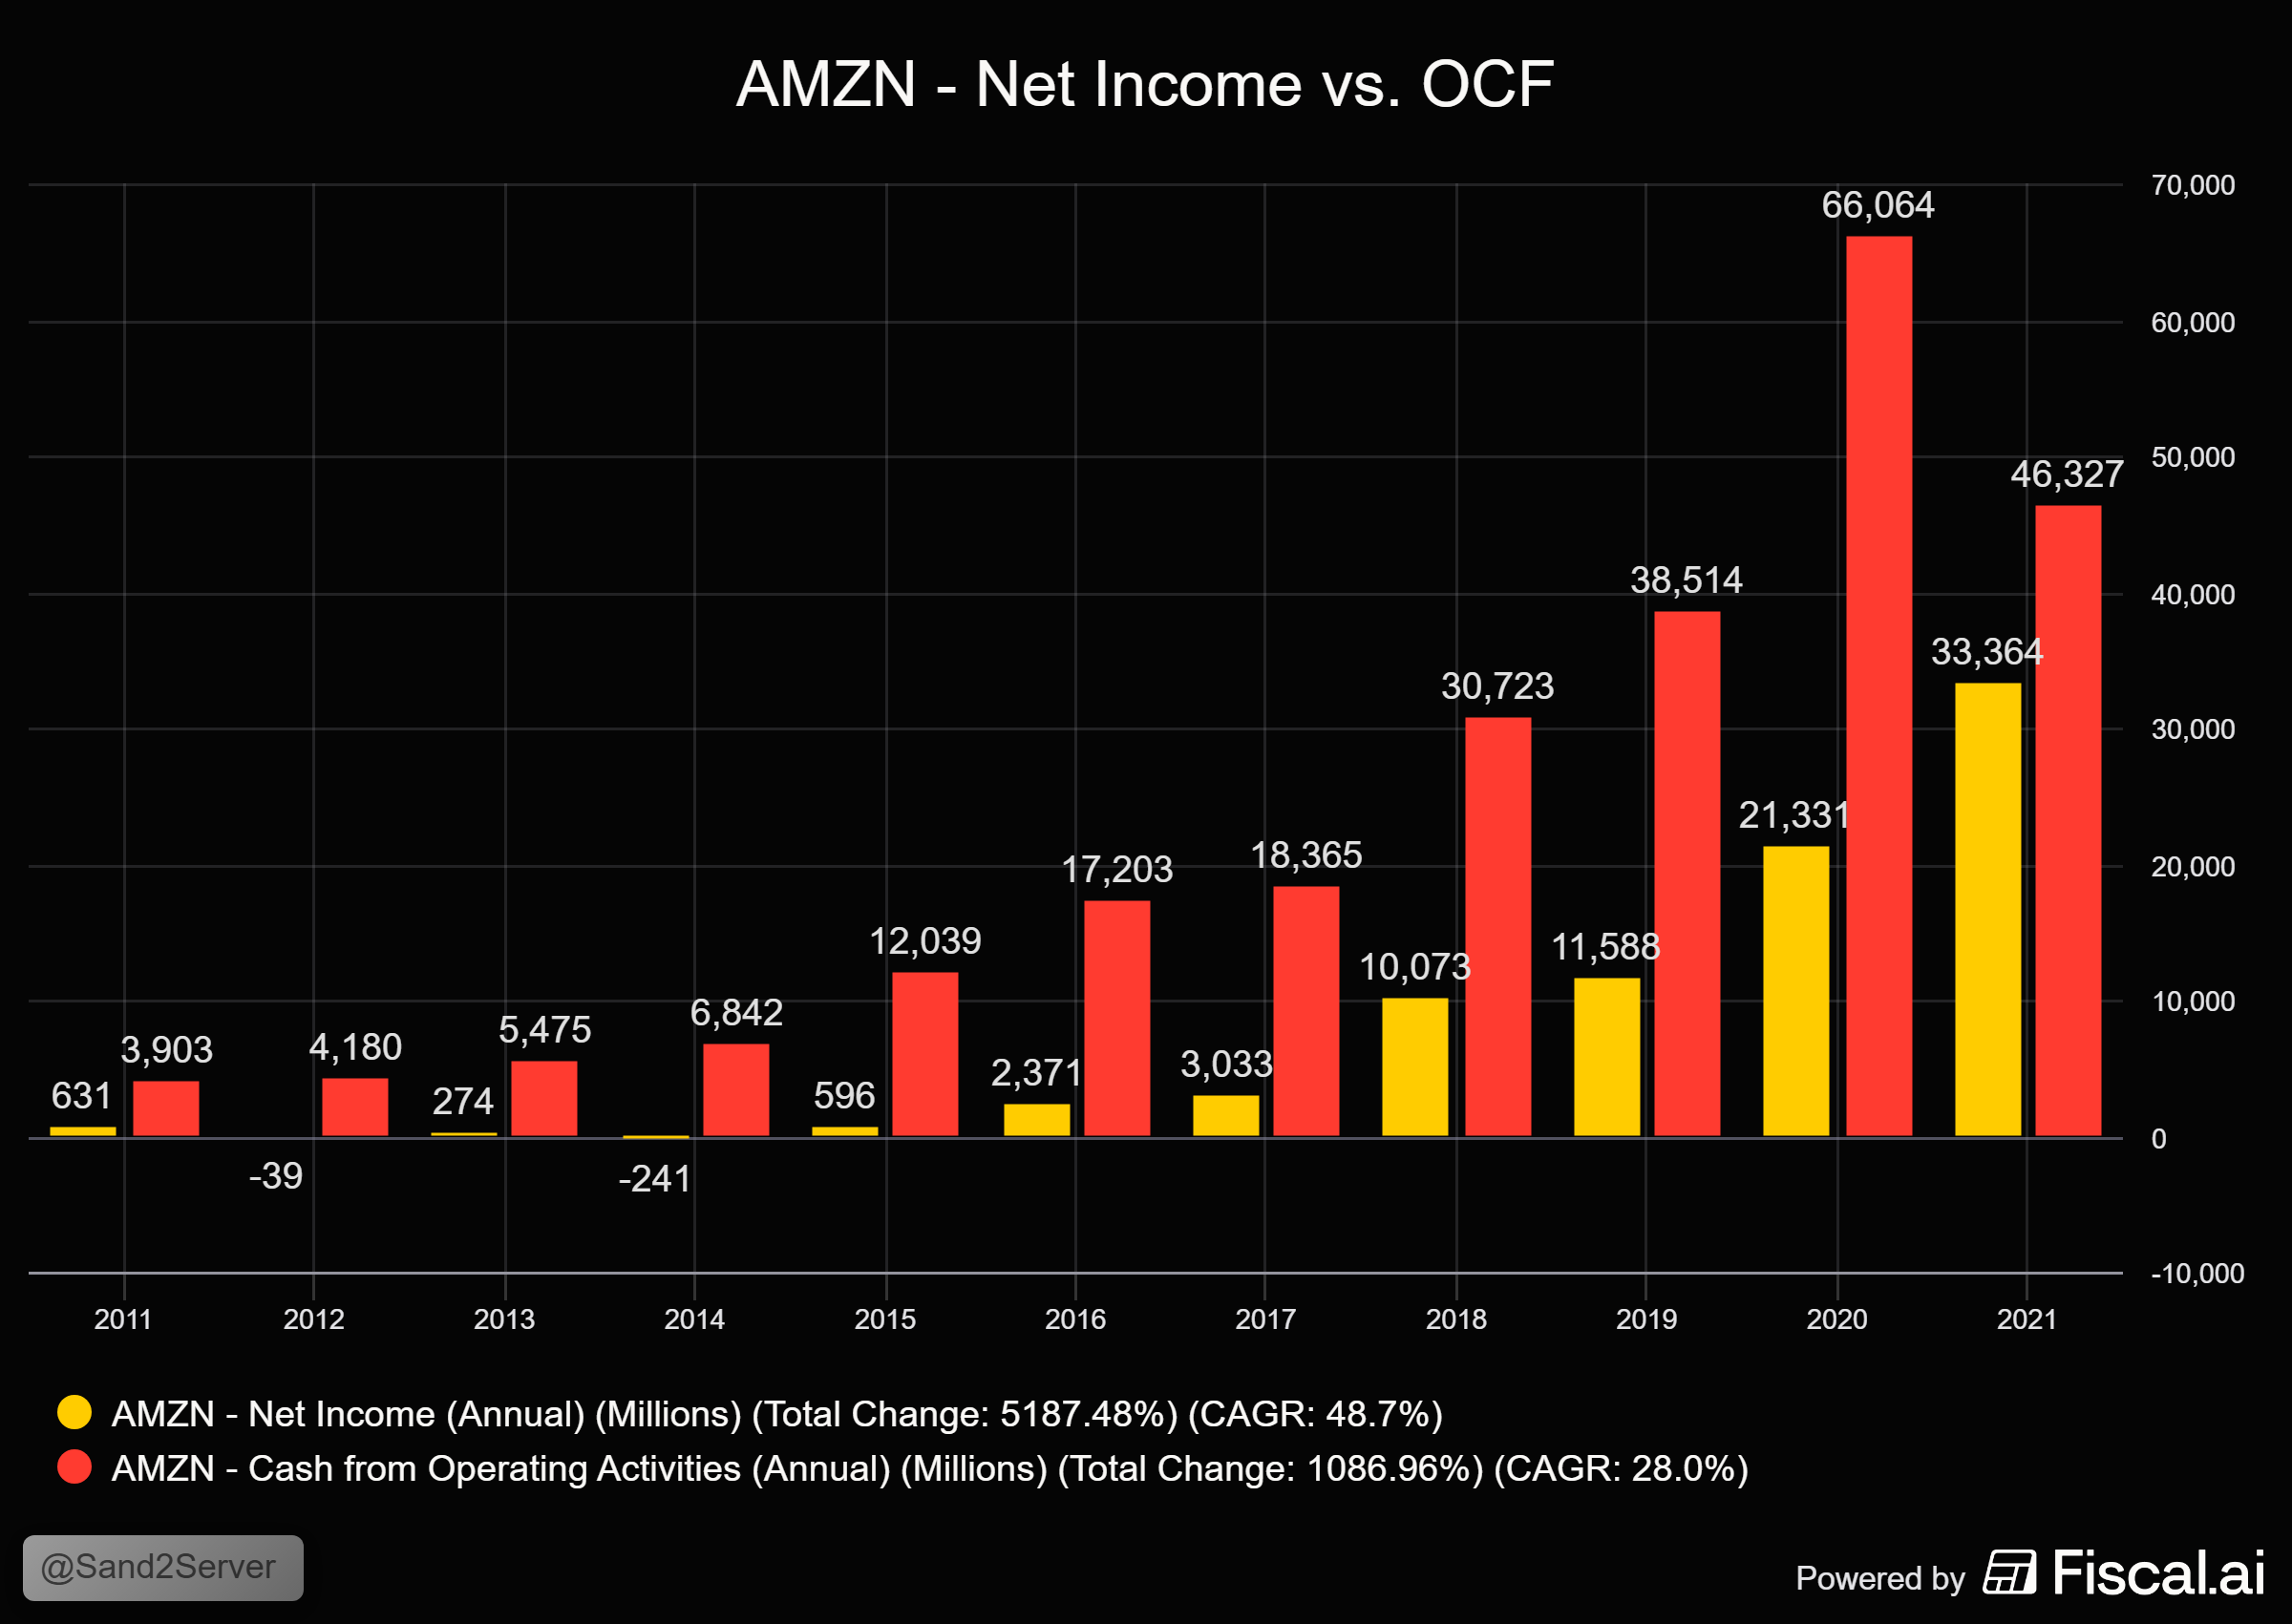
Case Study: Look at Amazon in its early years. Its GAAP profit was zero, but its operating cash Flow was massive because it was “expensing” its future. (also doing a lot of capital leases and having had a favorable (negative) cash conversion cycle).
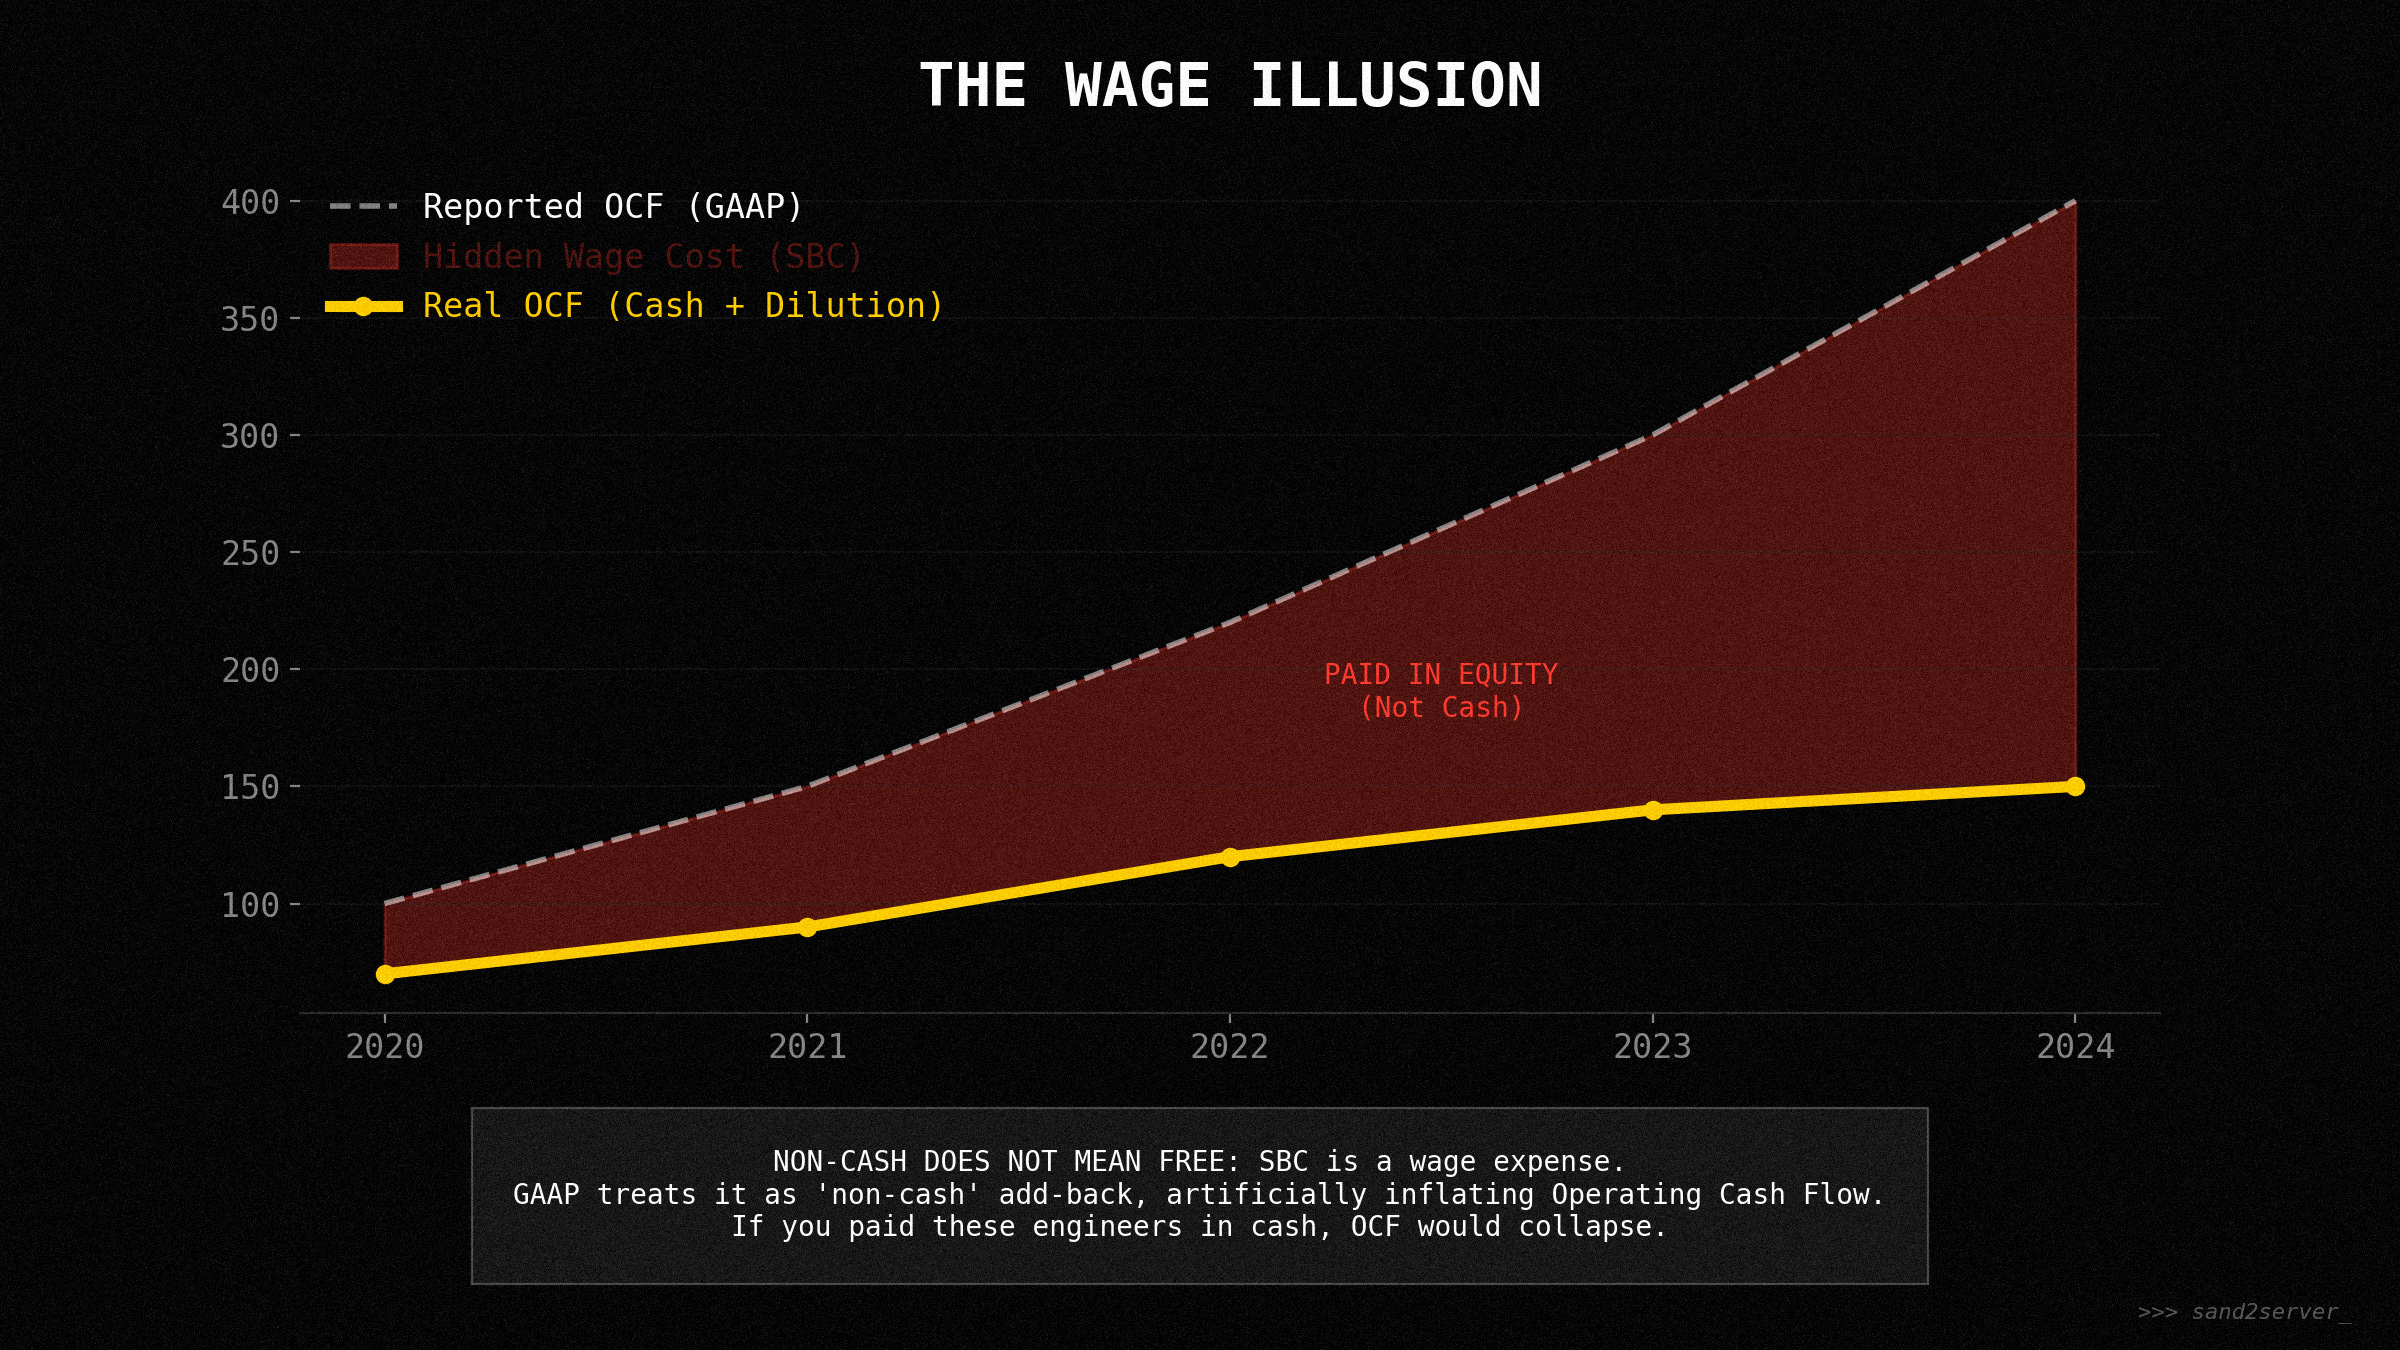
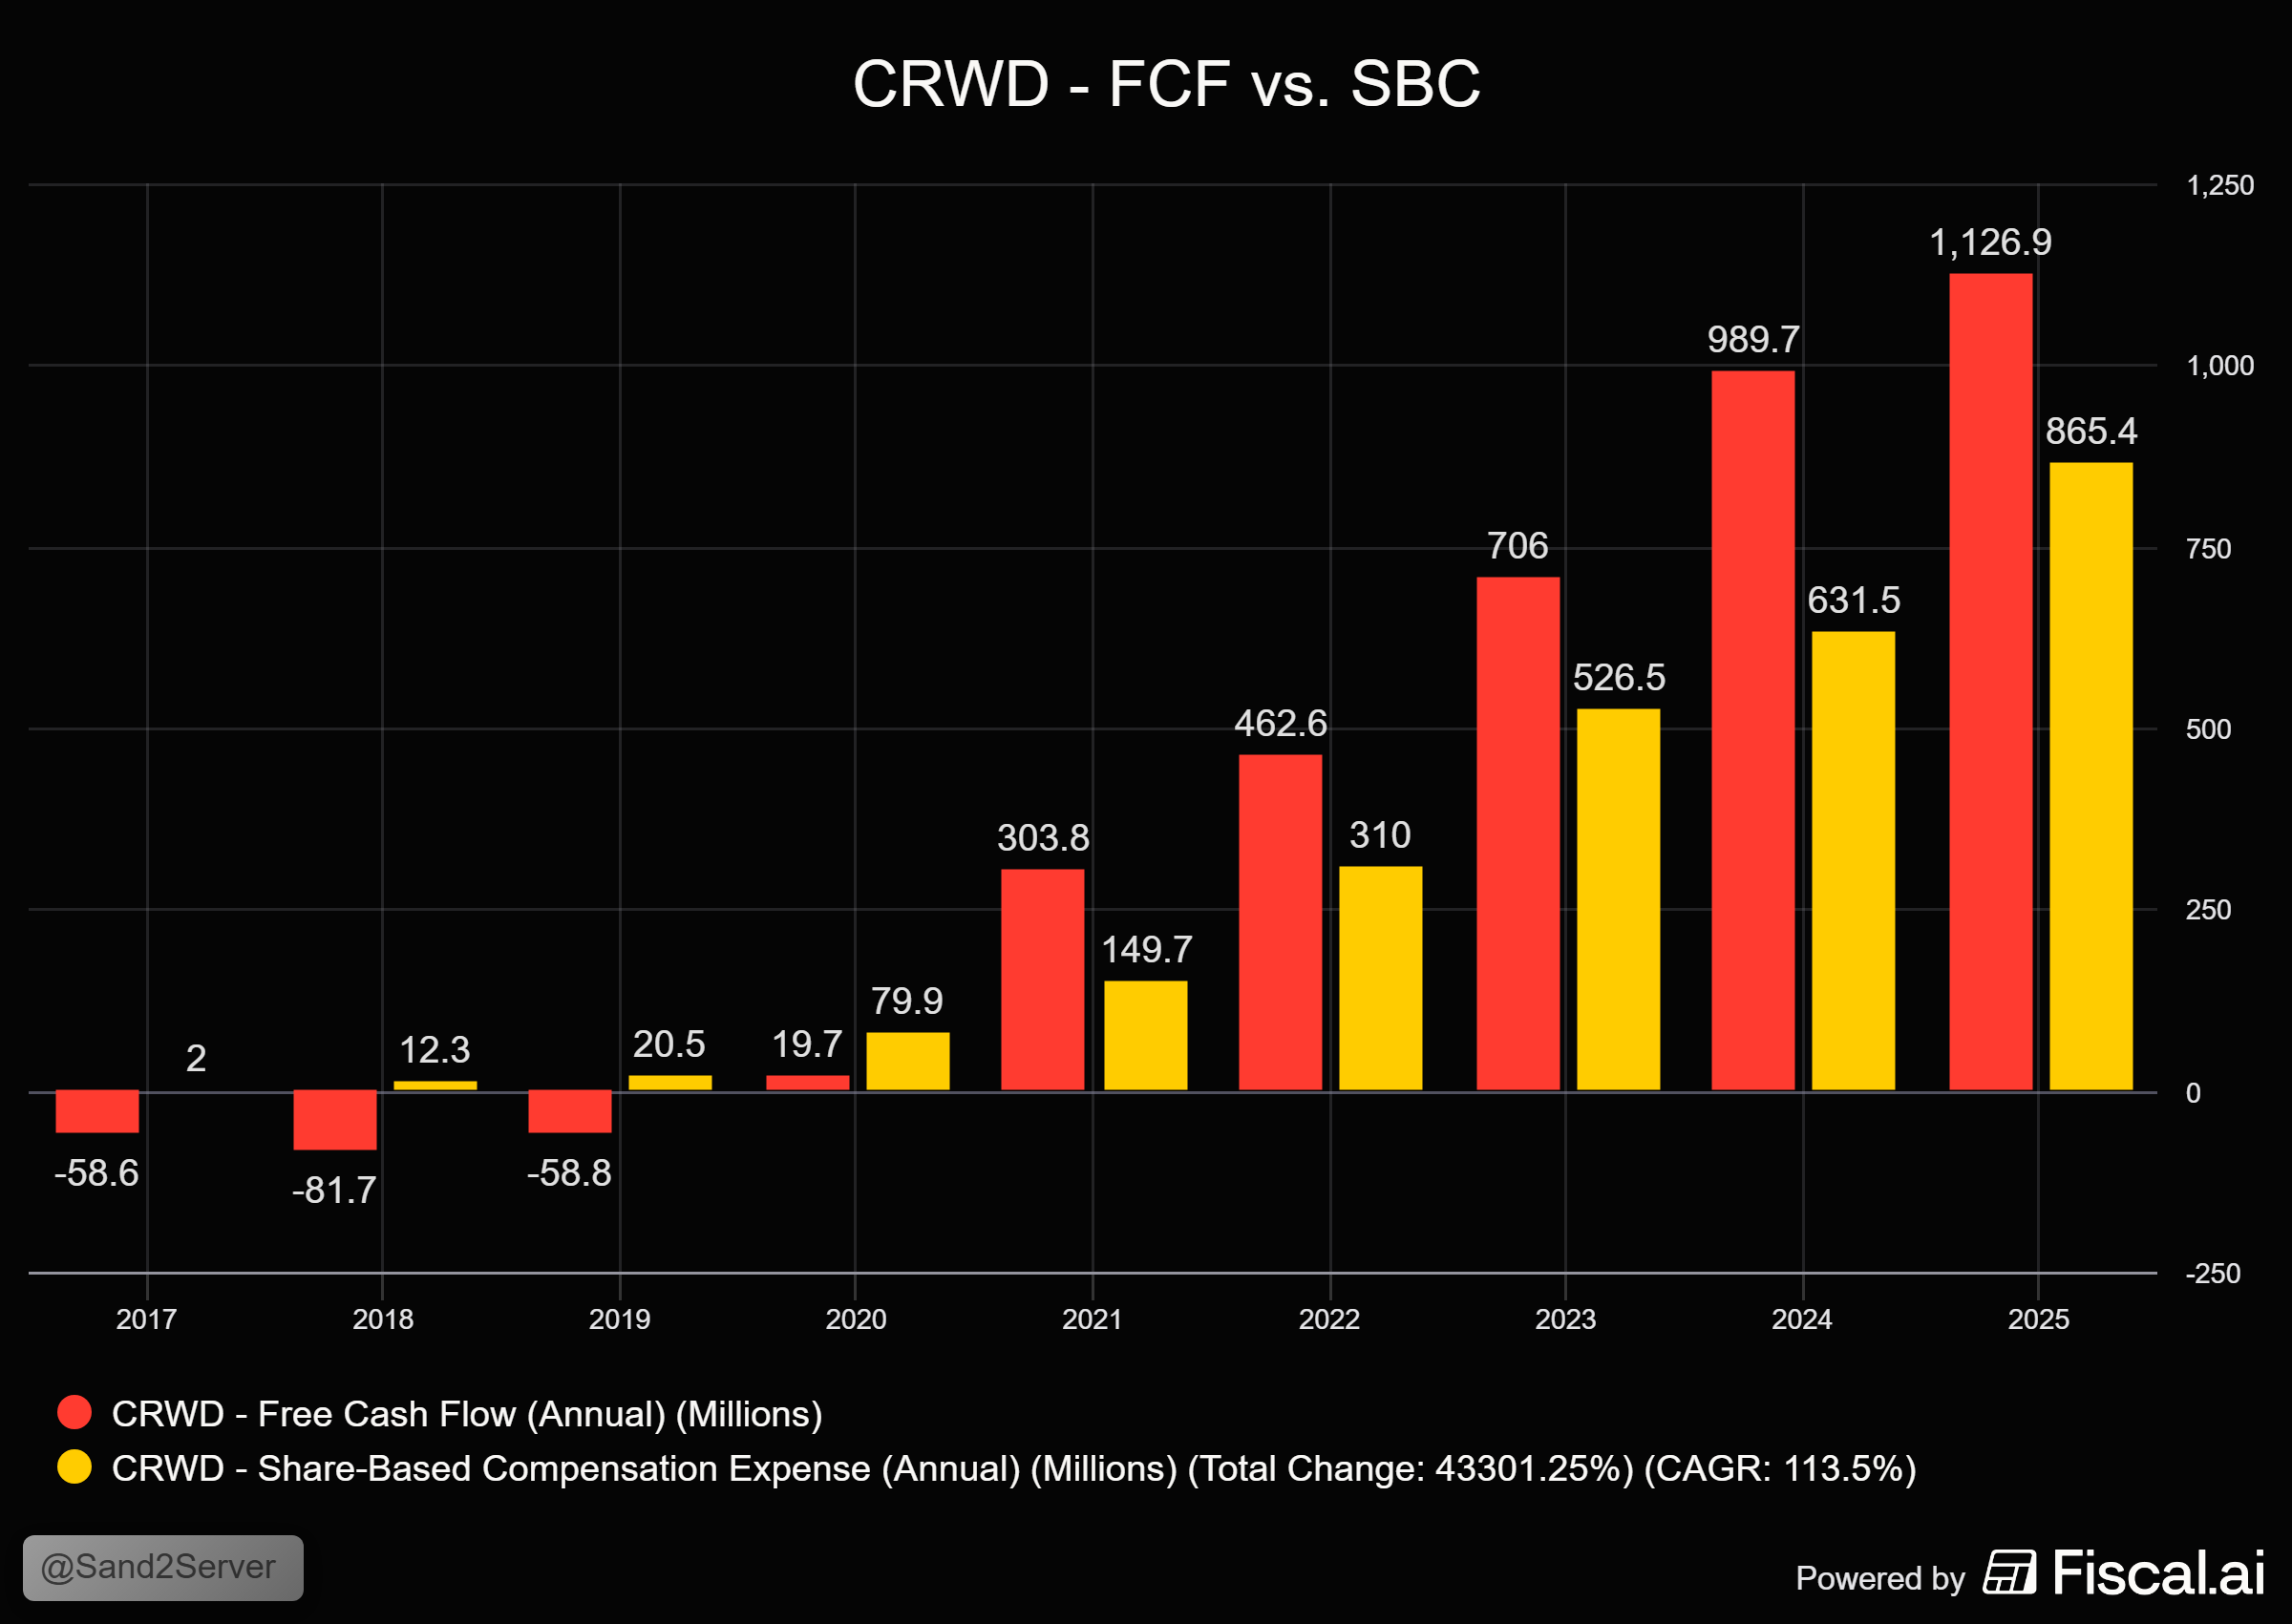
2. Schrödinger’s Equity: Stock-Based Compensation (SBC)
SBC is a “ghost in the machine.” Companies “add it back” to earnings because it’s non-cash.
The Reality: If you pay your engineers in stock instead of cash, you are selling pieces of the house to pay the electric bill. It is a real cost to you, the owner.
The Debugger’s View: Treat SBC as a 1:1 cash expense. If the business isn’t profitable after SBC, it’s not a business - it’s a wealth transfer.
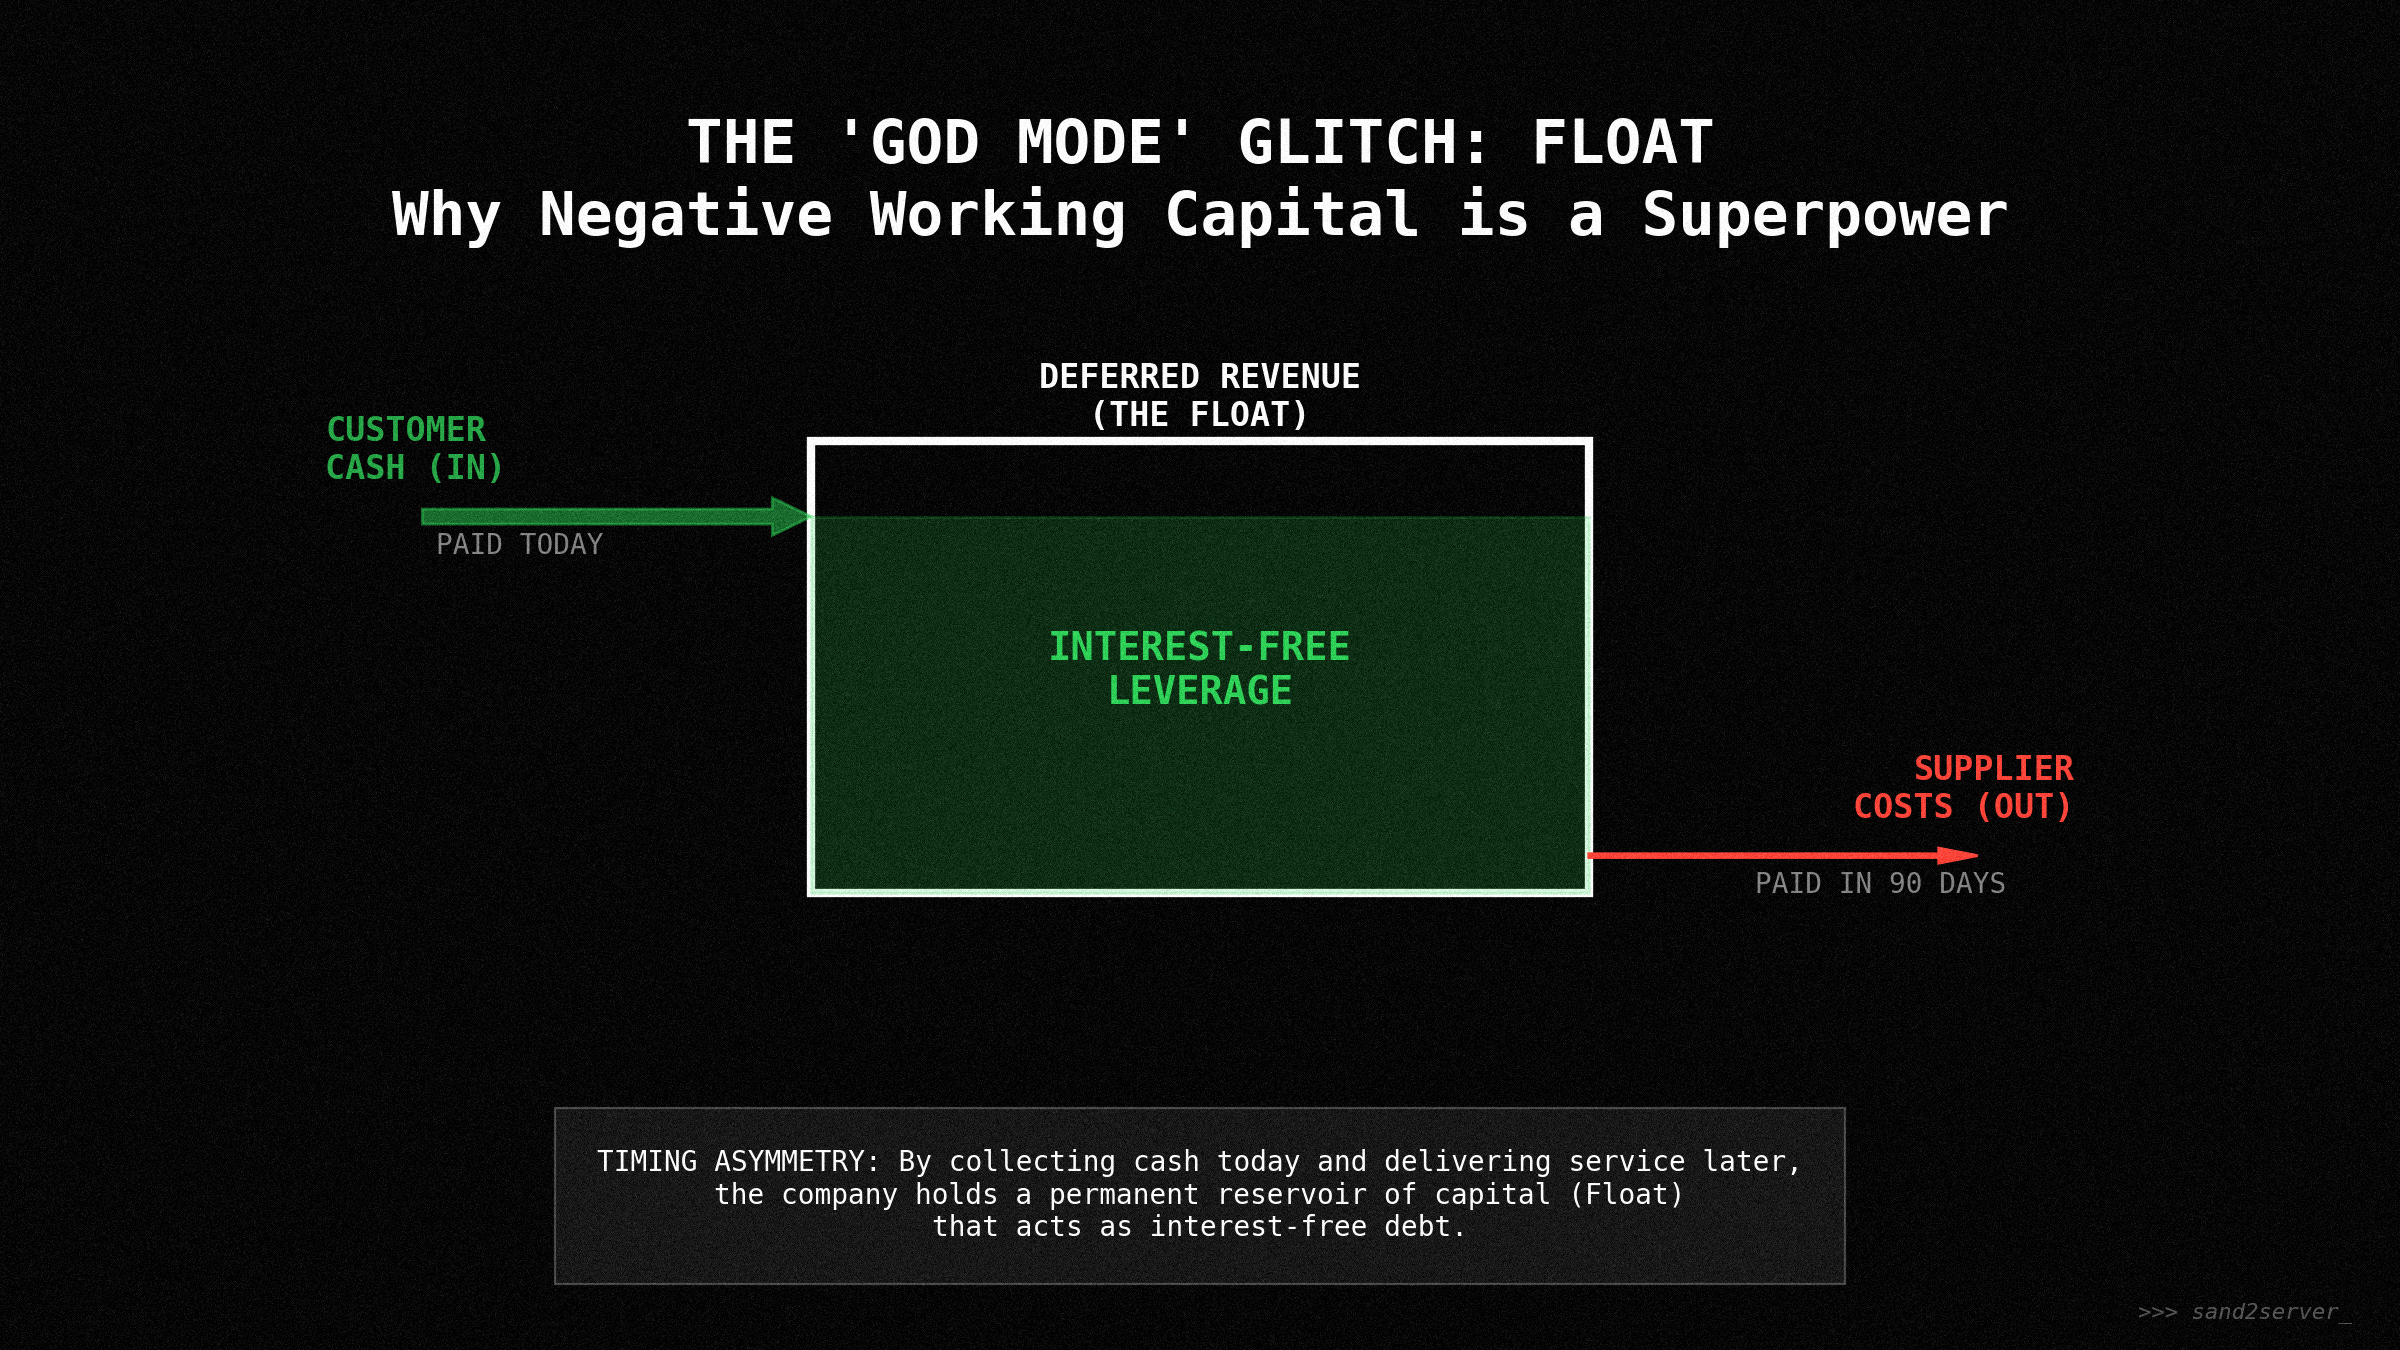
3. The “Float” Illusion (God Mode)
SaaS and high-velocity retail companies get paid by customers before they pay suppliers.
The Simulation: On a balance sheet, “deferred revenue” looks like a liability (Debt).
The Reality: This is the ultimate “glitch” in your favor. It is an interest-free loan from customers. This is why Snowflake or Crowdstrike can have insane FCF despite “optical” GAAP losses.
To understand this in depth, we need to discuss some terms.
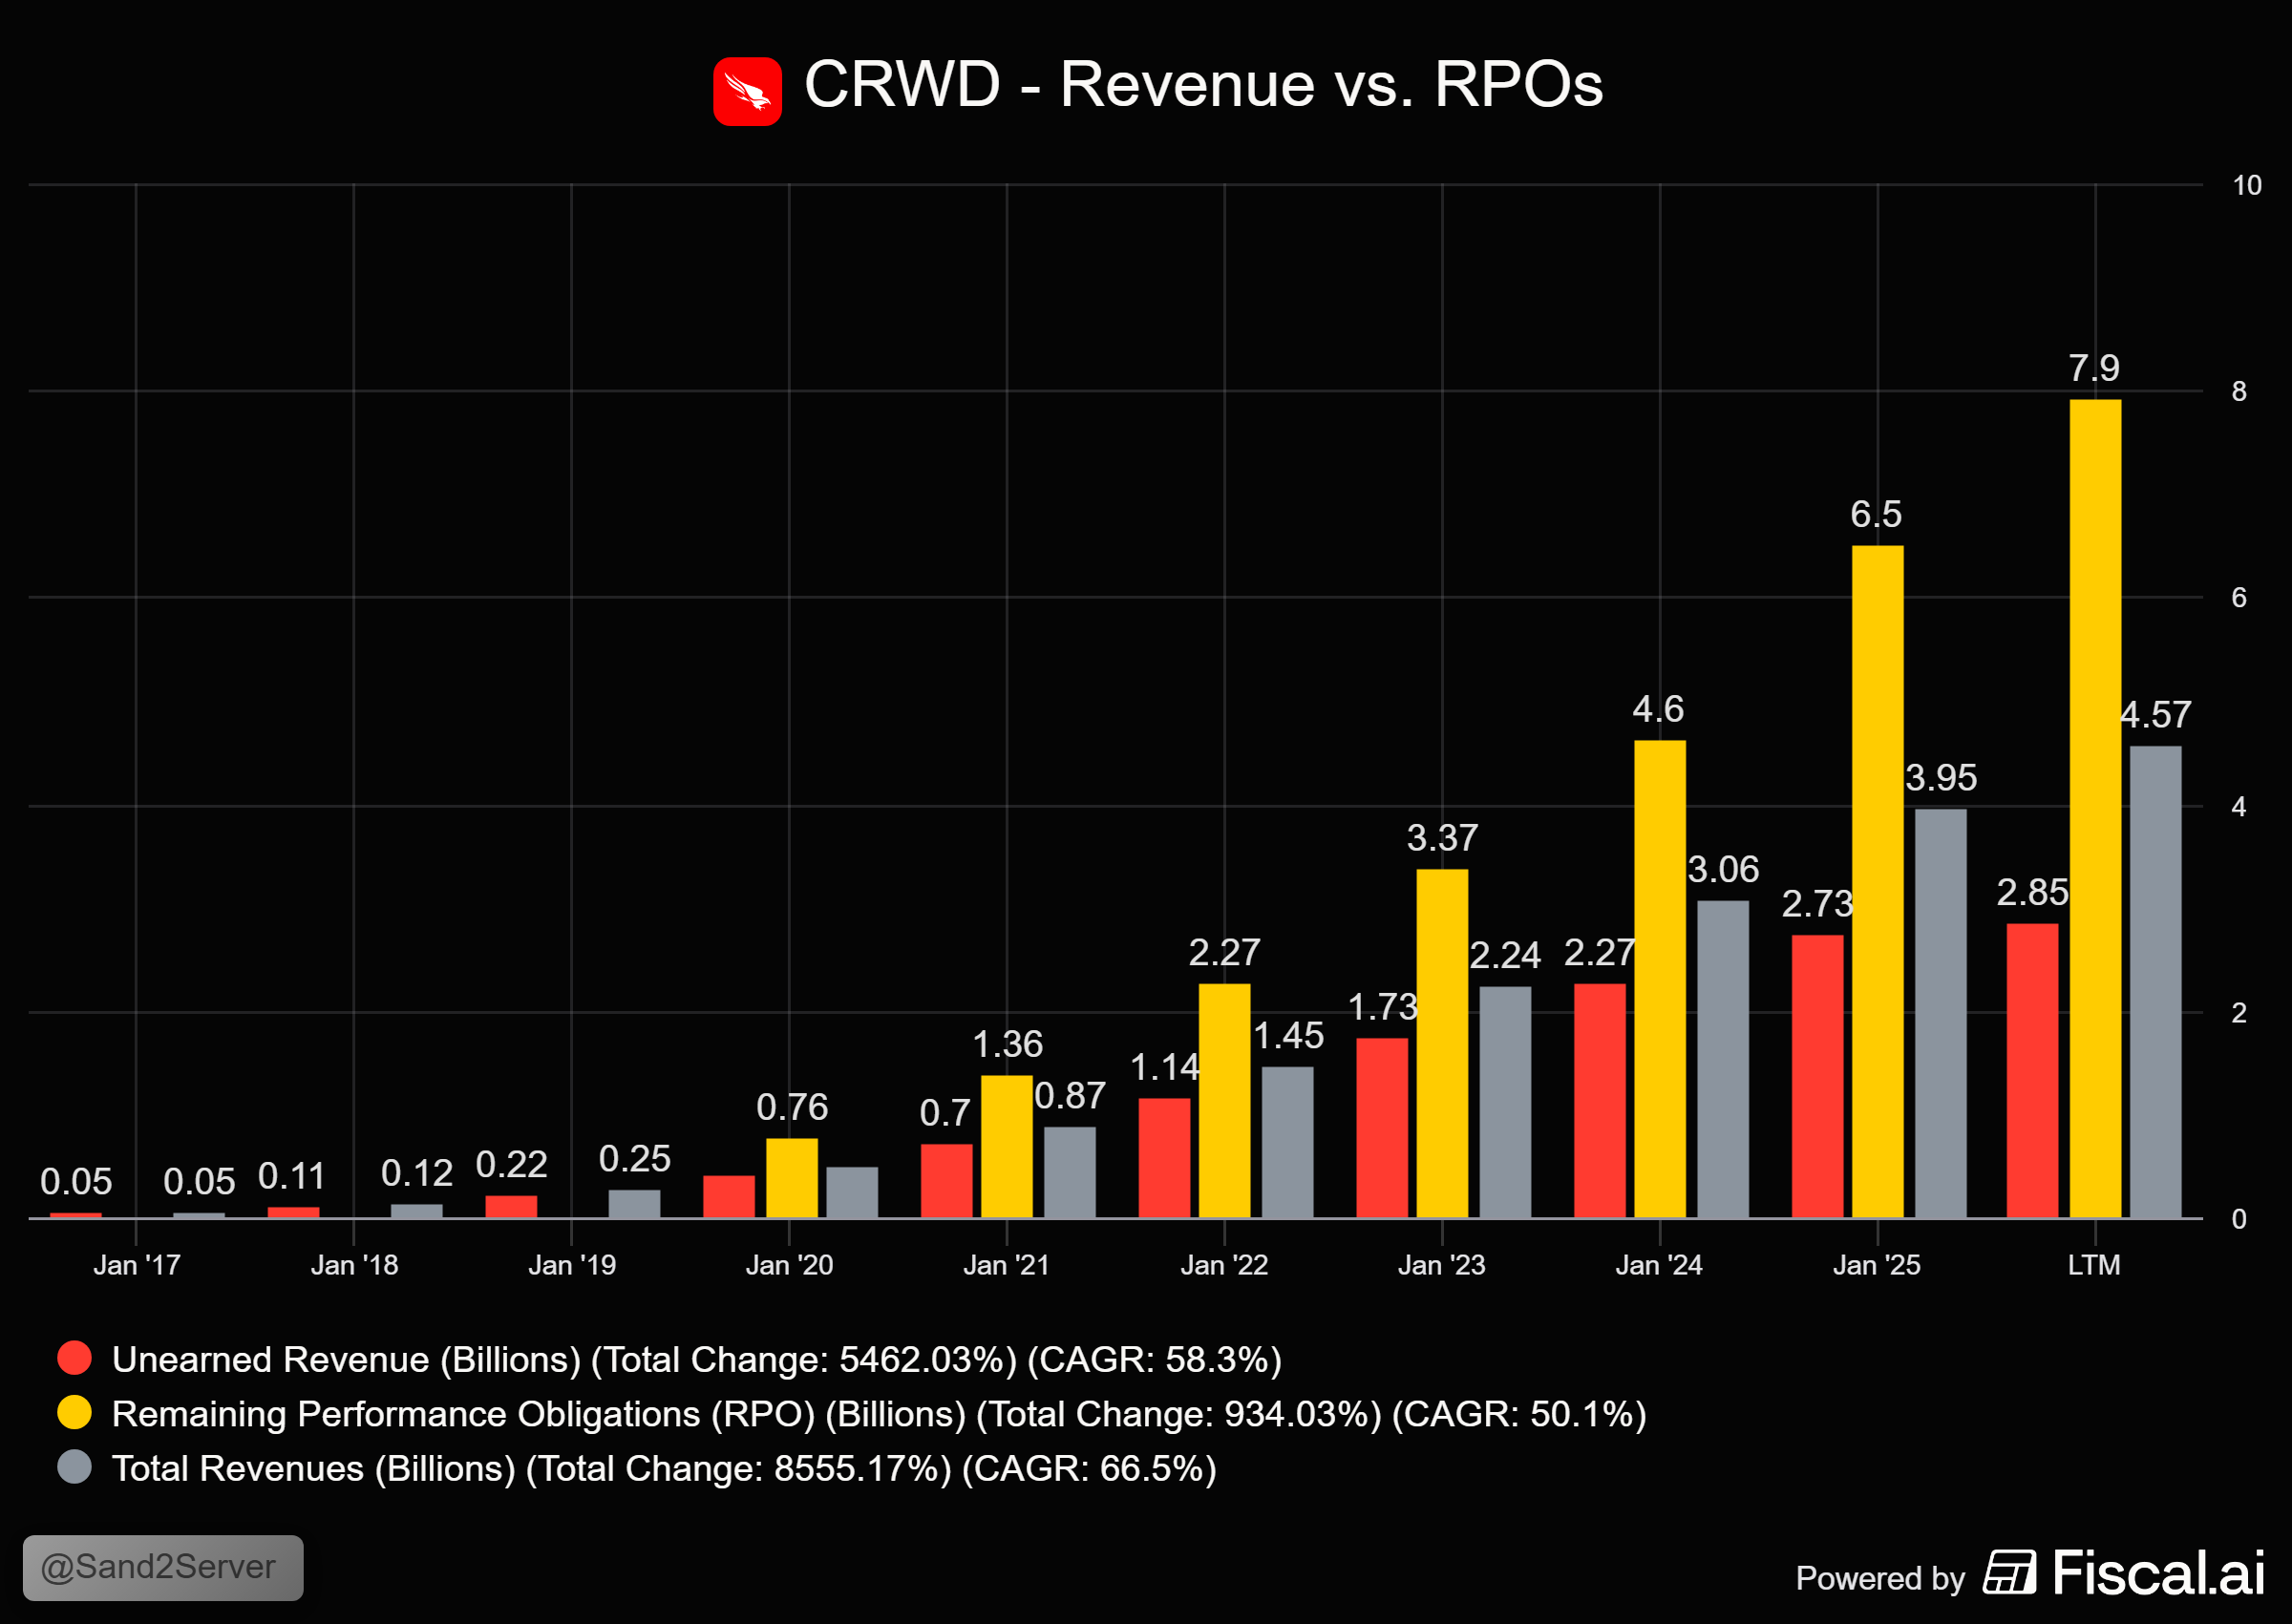
RPO = Deferred revenue (billed contracts) +
Backlog (unbilled contracts)RPO: Remaining performance obligations. This contains also multi-year deals
Deferred revenue: billed contracts, but not yet serviced
The weirdness: Because the bill annually upfront, CRWD is really holding that unearned revenue that is recorded as a current liability on the balance sheet as cash.
Don’t just look at revenue growth. If RPO is growing faster than revenue, the business is accelerating. If RPO is slowing down, the sales team is struggling, even if current revenue looks fine (because revenue is a lagging indicator).
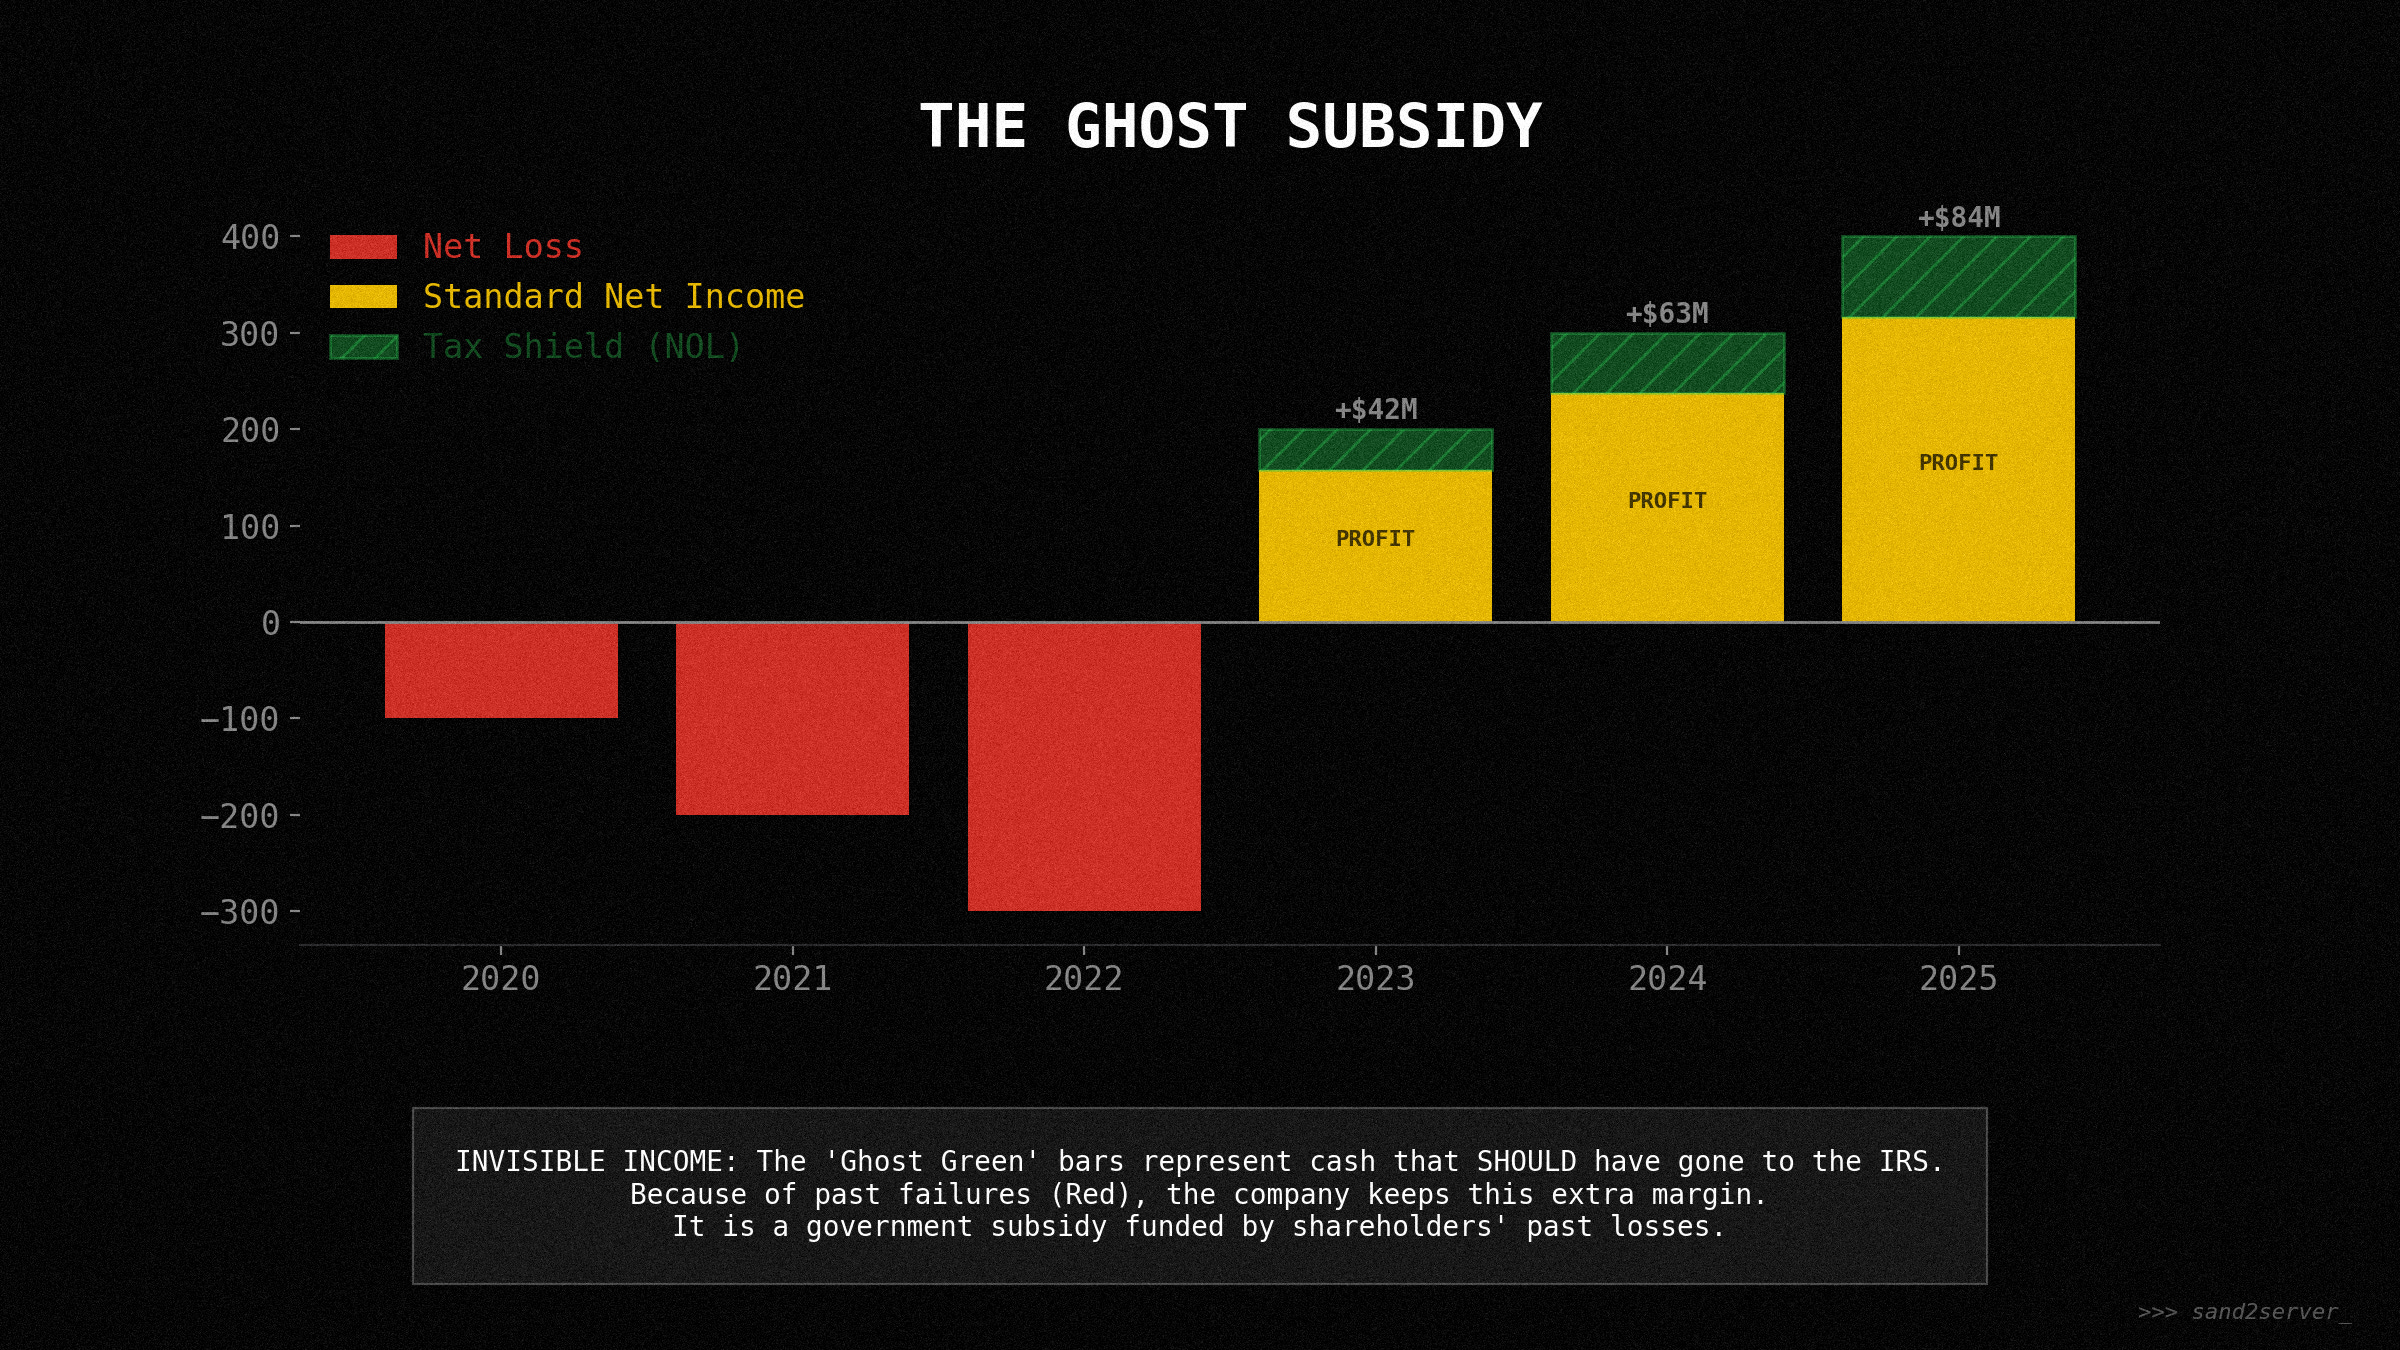
4. The Ghosts of Failures Past (NOLs)
Net operating losses (NOLs) are the “scars” of past losses.
The Reality: They are actually hidden assets. They act as “tax shields,” allowing a turnaround company to keep 100% of its future cash flow without paying the 21% corporate tax rate for years. This is why companies that are successfully re-structuring often explode in terms of their EPS. And share price. The market is suddenly seeing profits explode all while willing to price it at higher multiples for that improved outlook and financial results. It is re-rating plus tax-shield induced profit bumps.

FIG 11 // HE GHOST SUBSIDY - Monetizing past failure as future profit.
Part VI: The Scorecard is Not the Game
Consensus is priced in. If you invest based on the headline numbers - the P/E ratio or the EPS beat - you are betting on the map.
Alpha exists in the divergence. It exists in the company that looks expensive on P/E but cheap on cash flow. It exists in the company that looks profitable but is rotting from the inside due to aggressive capitalization.
Stay tuned on one of my next articles in CAPITAL that will deep dive into valuation and dissect the issues with historical valuation.
Part VII: The Debugger’s Manifesto
As a regulator, I assume the model is wrong until proven right. As an investor, you should do the same.
And keep in mind that all predictions are based on modeling the future. Models work with assumptions. They abstract from reality to reduce complexity. And thus, these models and inherently always uncertain.
The Full Stack Audit Protocol
Trust cash, verify profit.
Audit the incentives. Read the proxy statement. If management is paid on “Adjusted EBITDA,” expect a simulation full of add-backs.
Check the “source code.” Read the “Summary of significant accounting policies” in the 10-K.
The accounting layer is a mental model. It was designed to reduce complexity, but in doing so, it hides risk.
Don’t just read the map. Walk the territory.
Thanks for reading!

Please consider helping me out, by subscribing - It’s free!
Or share / restack the article!
Disclaimer: Not financial advice. Do your own research and due diligence. Please refer to this page.